M/M PPI at Bloomberg consensus, core slightly above. At the m/m, q/q and y/y horizons.
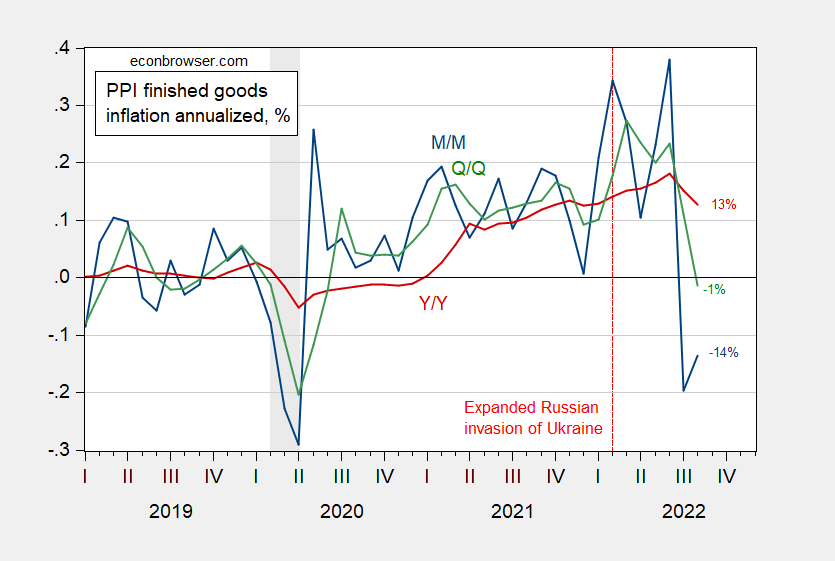
Figure 1: Month-on-month annualized PPI (final demand) inflation (blue), Quarter-on-quarter (green), year-on-year (red), %. NBER defined recession dates peak-to-trough shaded gray. Source: BLS, NBER and author’s calculations.
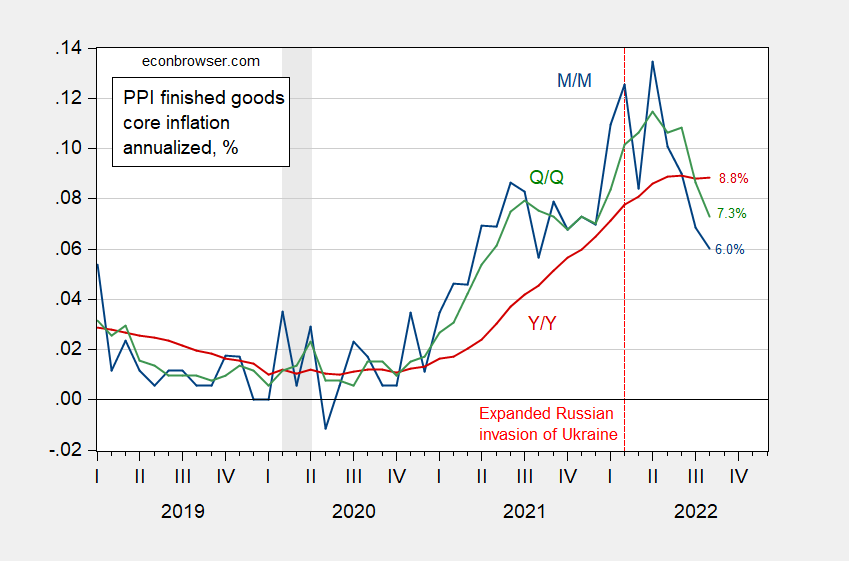
Figure 2: Month-on-month annualized core PPI (final demand) inflation (blue), Quarter-on-quarter (green), year-on-year (red), %. NBER defined recession dates peak-to-trough shaded gray. Source: BLS, NBER and author’s calculations.
Does the PPI lead the CPI? Some pictures.
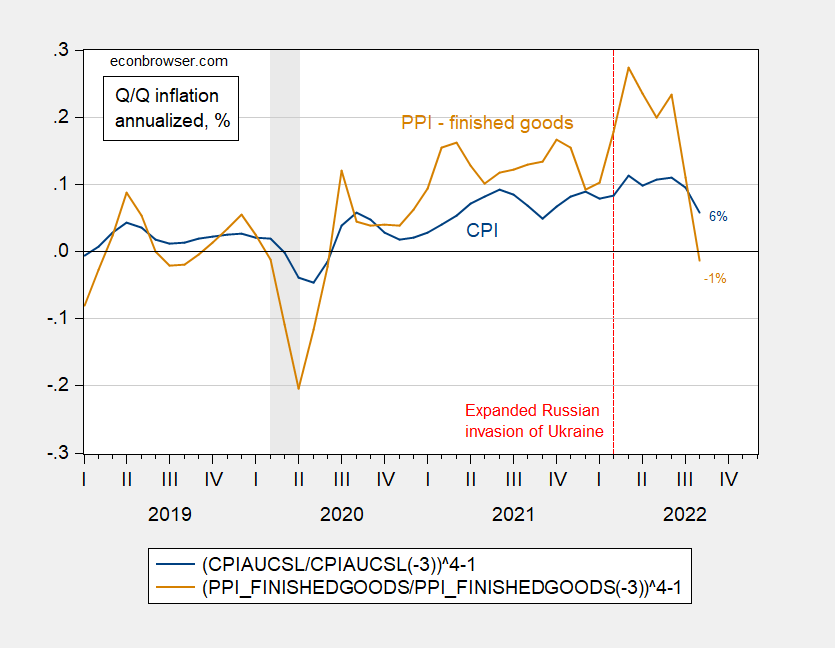
Figure 3: Quarter-on-quarter CPI (blue), PPI finished goods (tan), %. NBER defined recession dates peak-to-trough shaded gray. Source: BLS, NBER and author’s calculations.
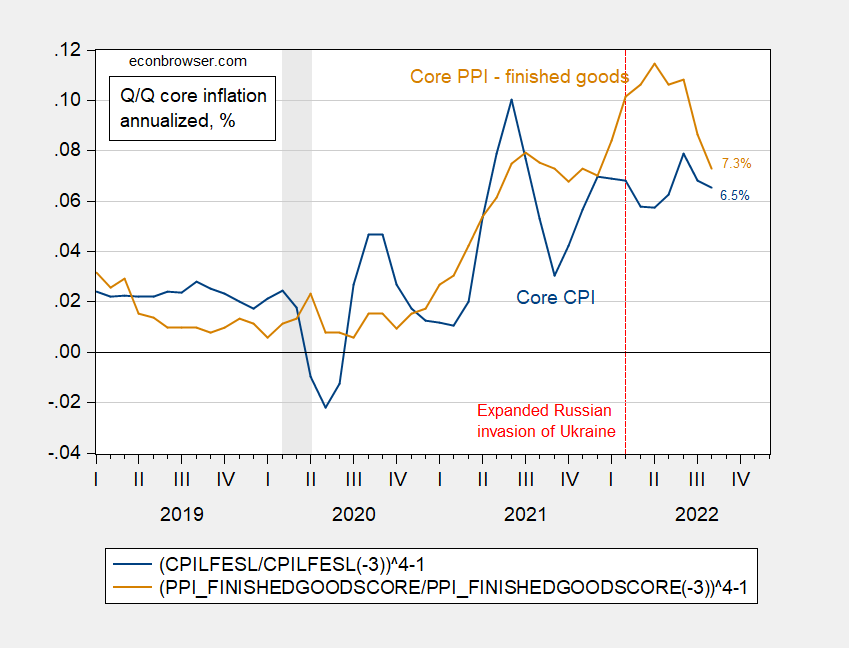
Figure 4: Quarter-on-quarter core CPI (blue), core PPI finished goods (tan), %. NBER defined recession dates peak-to-trough shaded gray. Source: BLS, NBER and author’s calculations.
It’s hard to see if PPI leads CPI in any reliable way, by just looking at the pictures (and in any case, important to remember the CPI includes services, while these PPI measures cover only final goods). From my August 2021 post on CPI and PPI:
Do PPI’s lead CPI’s in the US? Clark (1995) provides a skeptical view that PPI’s provide additional systematic predictive power.
Some analysts project that recent increases in prices of crude and intermediate goods will pass through the production chain and generate higher consumer price inflation. While simple economics suggests such a pass-through effect may occur, more sophisticated reasoning and careful consideration of the construction of the PPI and CPI data suggest any pass-through effect may be weak. Consistent with this more sophisticated analysis, the empirical evidence also shows the production chain only weakly links consumer prices to producer prices. PPI changes sometimes help predict CPI changes but fail to do so systematically. Therefore, the recent increases in some producer price indexes do not in themselves presage higher CPI inflation.
Caporale et al. (2002) uses a more formal multivariate approach to conclude that for G-7 economies, PPI’s do lead CPI’s. Whether these findings still pertain in the current environment (and using the updated versions of the PPI) remains to be seen.
In my April post, I noted increasing evidence that PPI Granger causes CPI, in a sample including the pandemic.
https://www.msn.com/en-us/news/world/biden-says-tentative-deal-reached-to-avert-rail-strike/ar-AA11R0YC?ocid=msedgntp&cvid=04a14185083b4b938f465f9a111e52d5
The White House on Thursday morning announced it had reached a “tentative” agreement to avert a national rail strike that had threatened the nation’s economy. President Biden said in a statement that the agreement would guarantee “better pay, improved working conditions, and peace of mind around their health care costs” for the workers.
It is a very good thing that we finally have a competent person in the White House after those four years of Donald Trump just watching Faux News and spewing his anger on the Twitter. Now I would suggest everyone would see this as good news.
Oh but wait – this news just ruined Bruce Hall’s year. After all he wakes every morning praying for people to suffer all sorts of misery so he can receive, cut and paste the latest from Kelly Anne Conway. MAGA!
Felicitations, QoQ is your novel lipstick on a pig schtick.
I don’t think you know how lipstick works.
So many good jokes here, roughly only 1/4 would get past Menzie. : ) Not a complaint, just a statement.
One of the service prices not in PPI is owners equivalent rent. Goods prices have cooled off. “Rent” has picked up. The trend in “rent” is also far less volatile than most for other prices, so we aren’t likely to see a cooling very soon.
https://fred.stlouisfed.org/graph/?g=TJYt