I asked this question of myself, as I prepared my lecture notes. As it turns out, not too badly, over the 1986-2022 period.
Consider:

Where the left hand side variable is annualized quarter-on-quarter PCE inflation, y is log GDP, yf is log full-employment or potential GDP, expected inflation is the Michigan survey one-year-ahead expectation, and z is a cost-push variable composed of the NY Fed Global Supply Chain Pressure Index (GSCPI), quarter-on-quarter annualized oil price inflation, and a lockdown dummy variable ( taking on a value of 1 March 2020 to February 2021)
A simple regression of inflation on output gap yields an adjusted R2 of zero. The full model estimated over the entire sample yields an adjusted R2 of 0.57, and a pretty good fit (tan line).
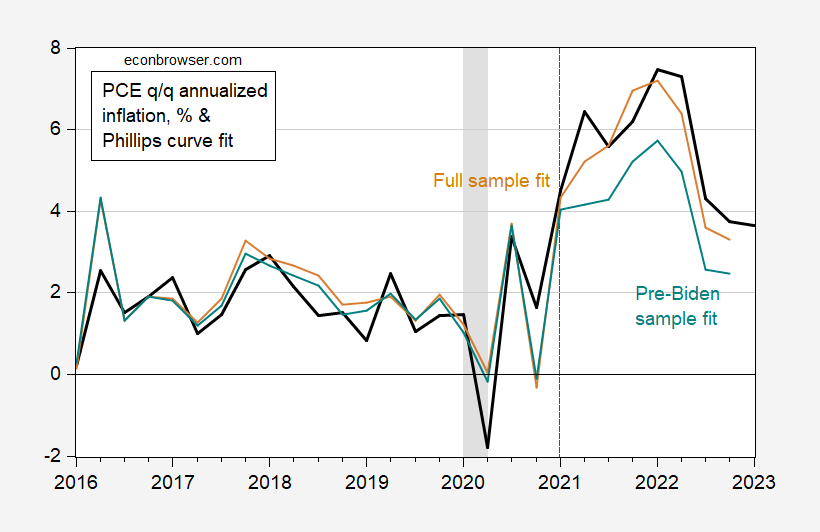
Figure 1: Actual quarter-on-quarter annualized PCE inflation (black), in-sample fit from augmented Phillips curve equation estimated on 1998-2022 (tan), and in-sample and out-of-sample fit for equation estimated on 1998-2020 (teal). 2023Q1 is for first two months of Q1. NBER defined peak-to-trough recession dates shaded gray. Source: BEA, NBER, and author’s calculations.
Of course, it’s pretty easy to fit in-sample (adjusted . The biggest recent prediction error is 0.9 ppts in 2022Q2 (the quarter after the expanded Russian incursion into the Ukraine). The question is whether we should’ve been surprised by inflation outcomes, given parameter estimates before the Biden administration. I attempt to assess this by estimating the model over the 1998-2020 period (adjusted R2 of 0.36) and predicting out of sample. This prediction is shown as the teal line; the prediction error is 2.3 ppts in 2022Q2 (note that I don’t say forecast error, as I’m using ex post realizations of the right hand side variables to make predictions; alternatively, you can call the 2021-22 period an ex post historical simulation).
The difference is driven by the lower coefficient associated with expected inflation in the truncated sample (0.24 vs. 0.44 in full sample) and lower coefficient on the supply chain pressure coefficient (0.60 vs. 0.92 in full sample).
The full sample estimates indicate that if GSCPI had held at 2020Q4 levels, the 2021Q4 inflation of 6.4% would have instead been 3.2% (with all other variables evolving as they did, which is of course unrealistic).
Forgive me if you noted this but what was the slope coefficient for the output gap?
pgl: Slope coefficient on output gap is 0.14 (significant at 5% msl), irrespective of full sample or truncated. A one percentage point increase in output gap lagged one quarter leads to a 0.14 increase in PCE inflation rate, q/q annualized.
Thanks. So it would take a 7% gap to lower inflation by a mere 1%. That sounds a lot like what Tobin was telling us some 40 plus years ago.
Is there any way to overlay the GSCPI number itself with the appropriate time frame on the graph?? I’ll admit I don’t “catch” everything, I miss factors sometimes. But when I just look at (“eyeball”) the GSCPI graph itself it seems to match up pretty damned close with the black line. Of course if I’m wrong it would be easy to see I’m wrong by overlaying them in graph form.
The wages argument on inflation has been a pile of crap from the get go.
The highest coefficient is for supply shocks. Next is inflation expectations. The smallest coefficient is for the output gap. Monetary policy aims at expectations and at the output gap, with no likely effect on supply shocks.
Employing pgl’s insight on the pre-Biden expectations coefficient, inflation expectations would need to fall tougher 4% to engineer a 1% drop in realized inflation. A 4% inflation overshoot would require a 16% drop in expectations, if no other effects were in operation? OK, let’s use the full-same coefficient and say a roughly 2.3% drop in expectations is needed to cause a 1% drop in realized inflation. Still not a great tool. Gap and expectations together, 0.56, though I guess there is no mechanism to tie a 1% drop in expected inflation to a 1% drop in the output gap. Still need a powerful whack at the economy to bring inflation down.
Deal with the supply shock and you deal with inflation. How? Time. Public-private cooperation in resource use. Avoid rail strikes. Go after profiteers. Provide easy access to day care. Assure excellent public health measures. Those efforts won’t provide a complete solution, but they have additional benefits and address the largest cause of inflation.
Oh, and going after the supply shock might also lower inflation expectations, though the output gap would be made more positive.
Show of hands: who’s opposed to full employment?
@ Macroduck
Larry Summers just came back to the classroom after using the restroom. Can you ask the question again??
https://twitter.com/JonSteinsson/status/1621577792487043072
Mike Konczal on labor markets:
https://twitter.com/mtkonczal/status/1644319728637190144?cxt=HHwWgICxqZmF5tEtAAAA
Worth the read (even for PhD economists):
https://www.ft.com/content/e1c6b39d-00ca-4976-bf10-0034727f9272
They even include something one of the commenters here on the blog once referred to as “raw data”. Albert Edwards may be my new hero in life. : )