Buffeted by SVB, income and spending, and PCE releases.
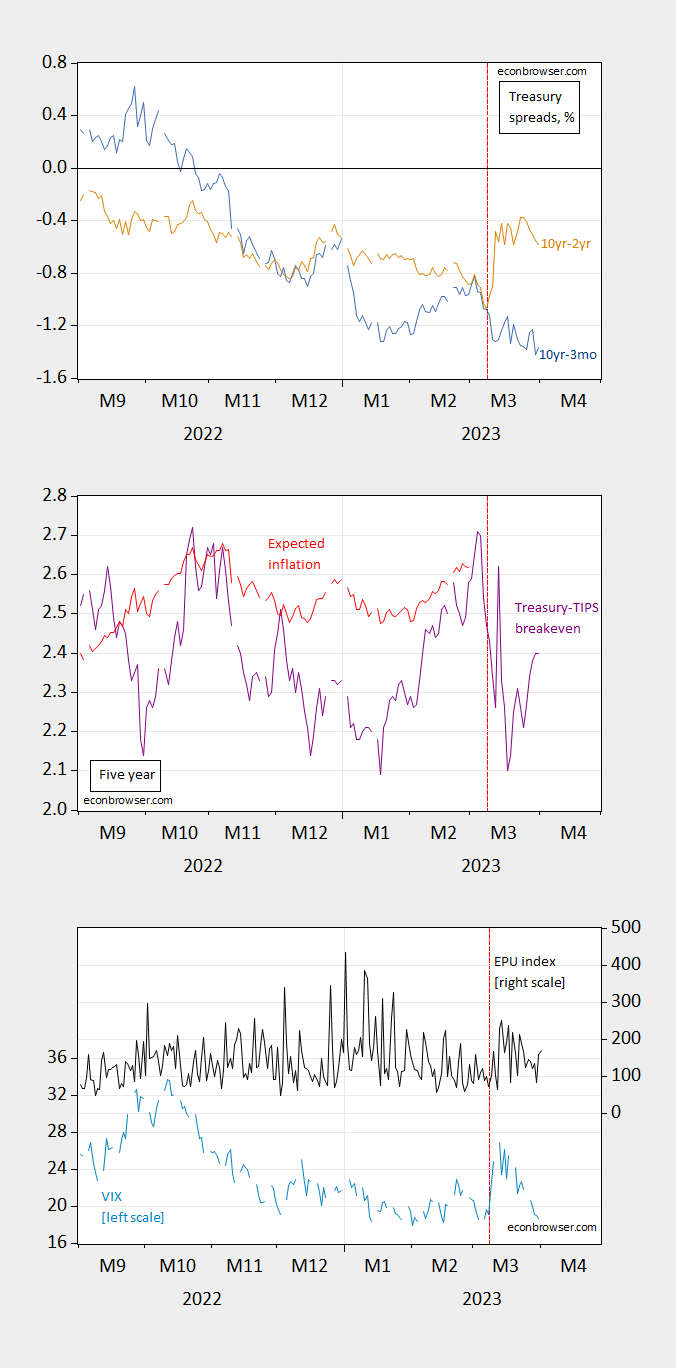
Figure 1: Top panel: 10yr-3mo Treasury spread (blue), 10yr-2yr spread (tan), both in %; Middle panel: 5 year Treasury-TIPS spread (purple), 5 year spread adjusted for liquidity and risk premia (red); Bottom panel: VIX (sky blue, left scale), EPU (black, right scale). Source: Treasury via FRED, KWW following D’amico, Kim and Wei (DKW), CBOE via FRED, policyuncertainty.com.
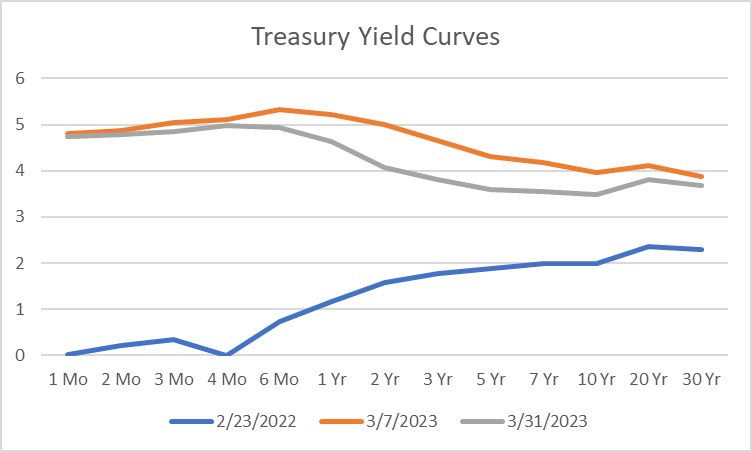
The 10yr-2yr has risen, while the 10yr-3mo remains deeply mired in negative territory. Here’s what the yield curve looks like as of Friday relative to pre-SVB, and relative to pre-Ukraine.
Source: Treasury.
Pre-Ukraine, the yield curve was signalling continued growth. Even before SVB’s collapse, the yield curve had inverted along a broad portion of the spectrum, and post-SVB it has even more at the 2 yr-6 mos portion.
The 5 year Treasury-TIPS spread has come down, although with premia also likely changing, it’s hard to say what this means. Risk as measured by the VIX has come down too, while uncertainty as measured by the Baker, Bloom & Davis “news”-based measure remains elevated.
I do think it interesting that the 5 year TIPS has come down. In fact, essentially the entire nominal rate decrease is accounted for by the real rate decrease, suggesting decreased economic activity.
The jump in oil prices in response to reduced OPEC+ pledged output is likely to alter rates (next post).
Have any recent studies shown how well TIPS breakeven forecasts actual inflation?
Yardeni published the answer just after I asked the question. It turns out that, starting in 2021, TIPS Breakevens are wildly inaccurate. Estimates of “real” interest rates from TIPS are just as inaccurate. Maybe we should just refer to it as a fixed rate and dispense with the notion that there is anything real about the “real rate.”
https://www.yardeni.com/pub/expectinflat.pdf
One thing for sure. Anyone who bought a 5 year TIPS in late 2020 or early 2021 and holds it to maturity is making out like a bandit. I missed this one but did pretty well with the I-bonds I bought in 2000 and the TIPS I bought for my IRA in October, 2008.
Reversed yield curves indicate that market participants will rather lock in the lower yielding long bonds now than buying a shorter bond at higher yields now, and then risk having to renew at a much lower yield in 3 month to 2 years. So the basis for reversed yields is the prediction of falling interest rates in the near future.
Normally we interpret reversing yield curves with the markets predicting a severe loss in economic growth (recession) which always precipitate a lowering of interest rates. Question is whether the markets got the prediction of falling interest rates right – but that fall will not be associated with significant economic slowing (at least not to the point of a recession)?
“Inverted” yield curve is the tenchnical term friend. I’m not telling you this in “know it all” fashion. I’m telling you as someone who has made this type of “error” thousands of times. But the main thing is we know/knew what you meant. God bless