Today, we present a guest post written by David Papell and Ruxandra Prodan, Professor and Instructional Associate Professor of Economics at the University of Houston.
The Federal Open Market Committee (FOMC) raised the target range for the federal funds rate (FFR) by 25 basis points to between 5.0 and 5.25 percent in its May 2023 meeting. This followed rate increases totaling 4.75 percentage points between March 2022 and March 2023 preceded by two years at the Effective Lower Bound (ELB). The FOMC did not provide any guidance about the future path of the FFR beyond the March 2023 Summary of Economic Projections (SEP).
There is widespread agreement that the Fed fell “behind the curve” by not raising rates when inflation rose in 2021, forcing it to play “catch-up” in 2022. “Behind the curve,” however, is meaningless without a measure of “on the curve.” In the latest version of our paper, “Policy Rules and Forward Guidance Following the Covid-19 Recession,” we use data from the SEP’s from September 2020 to March 2023 to compare policy rule prescriptions with actual and FOMC projections of the FFR. This provides a precise definition of “behind the curve” as the difference between the FFR prescribed by the policy rule and the actual or projected FFR. We analyze four policy rules that are relevant for the future path of the FFR in the post:
The Taylor (1993) rule with an unemployment gap is as follows,

where is the level of the short-term federal funds interest rate prescribed by the rule, is the inflation rate, is the 2 percent target level of inflation, is the 4 percent rate of unemployment in the longer run, is the current unemployment rate, and is the ½ percent neutral real interest rate from the current SEP.
Yellen (2012) analyzed the balanced approach rule where the coefficient on the inflation gap is 0.5 but the coefficient on the unemployment gap is raised to 2.0.

The balanced approach rule received considerable attention following the Great Recession and became the standard policy rule used by the Fed.
These rules are non-inertial because the FFR fully adjusts whenever the target FFR changes. This is not in accord with FOMC practice to smooth rate increases when inflation rises. We specify inertial versions of the rules based on Clarida, Gali, and Gertler (1999),

where p is the degree of inertia and is the target level of the federal funds rate prescribed by Equations (1) and (2). We set as in Bernanke, Kiley, and Roberts (2019). equals the rate prescribed by the rule if it is positive and zero if the prescribed rate is negative.
Figure 1 depicts the midpoint for the target range of the FFR for September 2020 to March 2023 and the projected FFR for June 2023 to December 2025 from the March 2023 SEP. Following the exit from the ELB to 0.375 in March 2022, the FFR rose to 5.125 in May 2023 before being projected to fall in 2024 and 2025. The figure also depicts policy rule prescriptions. Between September 2020 and Match 2023, we use real-time inflation and unemployment data that was available at the time of the FOMC meetings. Between June 2023 and December 2025, we use inflation and unemployment projections from the March 2023 SEP. The differences in the prescribed FFR’s between the inertial and non-inertial rules are much larger than those between the Taylor and balanced approach rules.
Policy rule prescriptions are reported in Panel A for Figure 1 for the non-inertial Taylor and balanced approach rules. They are not in accord with the FOMC’s practice of raising the FFR slowly when inflation rises. The prescriptions for the two rules are identical at the ELB through March 2021. The FOMC fell behind the curve starting in June 2021 when the prescribed FFR increased from the ELB of 0.125 to 2.625 for the Taylor rule and to 0.875 for the balanced approach rule while the actual FFR stayed at the ELB. The policy rule prescriptions sharply increased through 2021 and peaked in March 2022 to 7.325 for the Taylor rule and 7.625 for the balanced approach rule when the FFR first rose above the ELB to 0.375. The gap also peaked in March 2022 at 700 basis points for the Taylor rule and 725 basis points for the balanced approach rule. The gap narrowed considerably between March 2022 and March 2023 as the FFR rose from 0.375 to 4.875 while the prescribed FFR’s were almost unchanged. Looking forward, the gap between the FFR projections and the policy rule prescriptions is almost zero in September 2023 and, starting in December 2023, the FFR projections are above the policy rule prescriptions through December 2025.
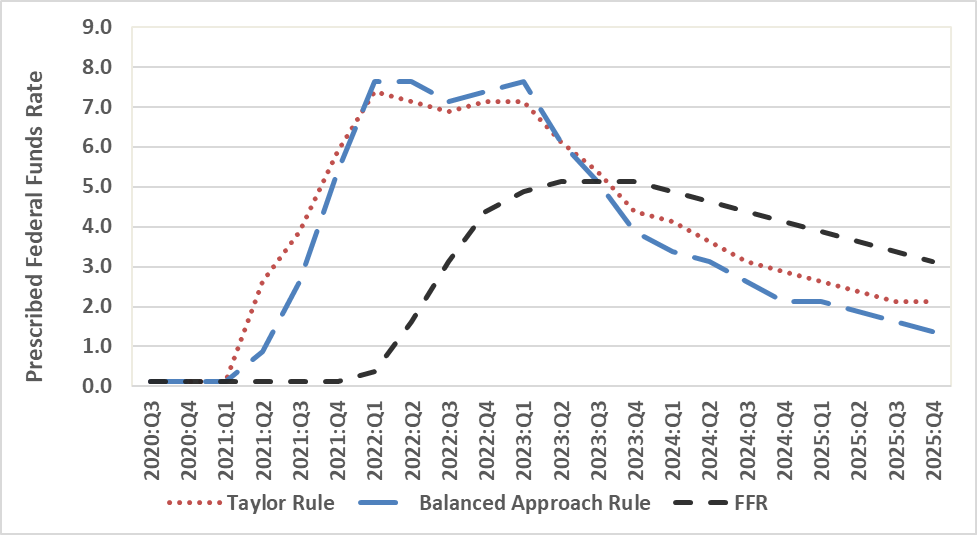
Figure 1, Panel A: The Federal Funds Rate and Policy Rule Prescriptions, Non-Inertial Rules
Panel B reports the results for the inertial Taylor and balanced approach rules. They are much more in accord with the FOMC’s practice of raising the FFR slowly when inflation rises. The prescriptions for the two rules are identical at the ELB through March 2021 and rise to 0.375 for the Taylor rule in June 2021. The FOMC fell behind the curve starting in September 2021 when the prescribed FFR increased to 0.875 for the Taylor rule and 0.375 for the balanced approach rule while the actual FFR stayed at the ELB. The gap between the policy rule prescriptions peaked in March 2022 at 200 basis points for the Taylor rule and 175 basis points for the balanced approach rule. At that point, the prescribed FFR was 2.325 for the Taylor rule and 2.125 for the balanced approach rule while the FFR first rose above the ELB to 0.375.
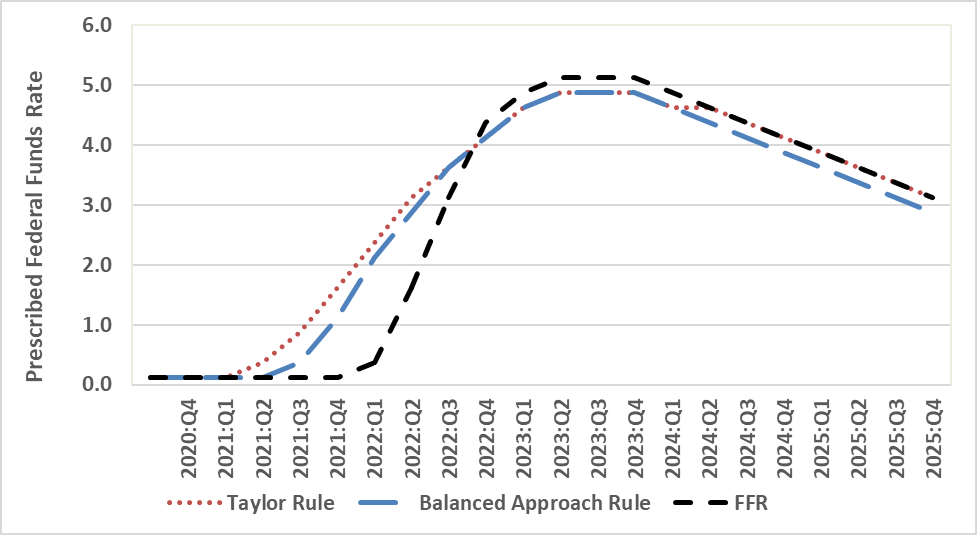
Figure 1, Panel B: The Federal Funds Rate and Policy Rule Prescriptions, Inertial Rules
The Fed is no longer behind the curve. The gap narrowed steadily and, in December 2022, the FFR was 25 basis points above both policy rule prescriptions. The inertial rules prescribe a much smoother path of rate increases from September 2021 through December 2022 than that adopted by the FOMC. If the Fed had followed the inertial Taylor or balanced approach rule instead of the FOMC’s forward guidance, it could have avoided the pattern of falling behind the curve, pivot, and getting back on track that characterized Fed policy during 2021 and 2022. Looking forward, the gap between the FFR projections and the Taylor rule prescriptions remains at 25 basis points between June 2023 and March 2024 and is zero between June 2024 and December 2025. The gap for the balanced approach rule prescriptions stays at 25 basis points through December 2025. The Fed is following the inertial Taylor rule.
This post written by David Papell and Ruxandra Prodan.
There is widespread agreement that the Fed fell “behind the curve” by not raising rates when inflation rose in 2021…
[ The essay is excellent, but I do not agree that the Fell ever fell behind the curve. Rather, I think Powell was honoring the dual mandate of the Fed and allowing for significant tightness in the labor market and in so doing adding to employment that would have been unthinkable under Greenspan, and allowing for significant wage increases for production and nonsupervisory employees in particular. The employment strength that the Fed allowed made it possible to avoid a recession through 2002 and a recession may well be avoided this year.
Powell and the Fed have been superb, and should be an example for quite a while. ]
Sorry about the typing error:
I do not agree that the “Fed” ever fell behind the curve.
Again, Fed policy has allowed for a remarkably high employment level and remarkable earnings gains for relatively low income employees Inflation is coming under control, while a recession has been avoided. Application of a version of Taylor Rule, strikes me as presenting an unhelpful Fed limitation when the Powell flexibility has proven necessary.
Changing direction a little, while I argue the Fed has done fine work in limiting inflation while sustaining high employment levels, the Fed bank supervision has been poor indeed. Banking supervision has been poor, and this is recognized now by Powell.
https://krugman.blogs.nytimes.com/2013/11/19/another-taylor-rule/
November 19, 2013
Another Taylor Rule
By Paul Krugman
Or at least it seems to be a new rule — namely, pick whatever price index makes the point you want, even if it’s not at all the price index you would normally use.
John Taylor says * that the U.S. economy was too experiencing a substantial acceleration of inflation during the years when he says monetary policy was too loose:
“Inflation was not steady or falling during the easy money period from 2003-2005. It was rising. During the years from 2003 to 2005, when the Federal Reserve’s interest rate was too low, the inflation rate for the GDP price index doubled from 1.7% to 3.4% per year. On top of that there was an extraordinary inflation and boom in the housing market as demand for homes skyrocketed and home price inflation took off, exacerbated by the low interest rate and regulatory policy.”
Um, the inflation rate for the “GDP price index”? That’s the GDP deflator, which the Fed very carefully does not use as a policy indicator. Why? Because it contains things like grain and oil prices, which fluctuate a lot, so that it’s an unstable measure that is highly unreliable as an indicator of underlying inflation. The Fed prefers the consumption deflator excluding food and energy. Here’s how the two compare since 2000:
https://static01.nyt.com/images/2013/11/19/opinion/111913krugman1/111913krugman1-blog480.png
Do you really think that the blue line, which has fluctuated wildly, should have been used to guide monetary policy? Was Taylor calling for gigantic monetary expansion in 2009, when the GDP deflator almost went negative? And using the Fed’s preferred measure, inflation was indeed quiescent during the “Bush boom.”
Oh, and if you’re going to use home prices — not rents — as a measure of inflation, you should know that it looks like this:
https://static01.nyt.com/images/2013/11/19/opinion/111913krugman2/111913krugman2-blog480.png
Again, wildly erratic (even more so) — and, by the way, negative when Taylor signed the debasement and inflation letter.
Actually, there’s a broader point. Taylor’s argument is that monetary policy was too loose during the boom; it’s also that monetary policy has been too loose during the slump. So it has basically always been too loose, for a decade or more. Yet inflation is lower now than it was in 2000. How is that possible?
* https://econospeak.blogspot.com/2013/11/john-taylor-on-monetary-policy-and.html