Do you calculate inflation differentials using … inflation or price levels? Follow up on this debate from a bit over a year ago.
Here’s a time series plot of the log ratio of US CPI to Euro Area 19 HICP (seasonally adjusted by author using X13) (blue line, left scale), and month-on-month inflation differential annualized (tan line, right scale).

Figure 1: Log ratio of US CPI-all urban to Euro Area 19 HICP (blue line, left scale), and month-on-month annualized inflation differential, in % (tan line, right scale). HICP seasonally adjusted using X13 log transform, X11 ARIMA seasonal adjustment. Inflation differential calculated using log first differences. Source: BLS, EC via FRED, and author’s calculations.
Summary of results on log ratio:
- ADF unit root test: fail to reject at 10% msl.
- DF-GLS (ERS) unit root test: fail to reject at 10% msl.
- KPSS trend stationary test: reject at 1% msl.
- Bai-Perron structural break tests of L+1 vs. L sequentially determined breaks: no breaks selected.
Summary of test results on m/m inflation rate differential:
- ADF unit root test: reject at 1% msl.
- DF-GLS (ERS) unit root test: reject at 1% msl.
- KPSS trend stationary test: fail to reject at 10% msl.
- Bai-Perron structural break tests of L+1 vs. L sequentially determined breaks: no breaks selected.
What about core?

Figure 2: Log ratio of US CPI-core to Euro Area 19 HICP core (blue line, left scale), and month-on-month annualized inflation differential, in % (tan line, right scale). HICP seasonally adjusted using X13 log transform, X11 ARIMA seasonal adjustment. Inflation differential calculated using log first differences. Source: BLS, EC via FRED, TradingEconomics, and author’s calculations.
Summary of results on log ratio for core:
- ADF unit root test: fail to reject at 10% msl.
- DF-GLS (ERS) unit root test: fail to reject at 10% msl.
- KPSS trend stationary test: reject at 1% msl.
- Bai-Perron structural break tests of L+1 vs. L sequentially determined breaks: 5 breaks selected; last one at 2019M05.
Summary of test results on m/m inflation rate differentials for core:
- ADF unit root test: reject at 1% msl.
- DF-GLS (ERS) unit root test: reject at 1% msl.
- KPSS trend stationary test: fail to reject at 1% msl, reject at 5% msl.
- Bai-Perron structural break tests of L+1 vs. L sequentially determined breaks: 2 breaks selected; last one at 2013M04.
While the trend break at 2021M02/03 is not statistically significant for core (using a dummy for inflation differentials, or a dummy interacted with trend for price ratio), you can see there is an acceleration in relative core.
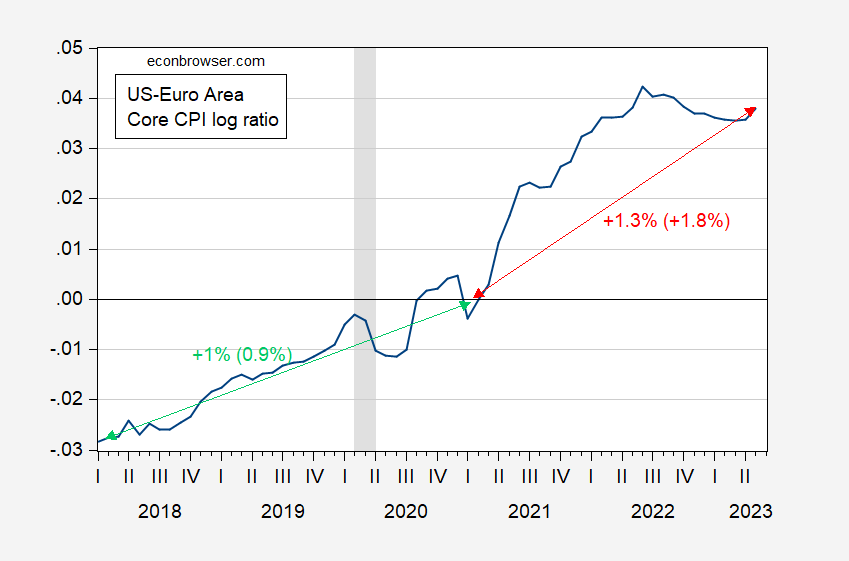
Figure 3: Log ratio of US to Euro Area 19 core prices, 2020M02=0 (blue). Green (red) arrow are deterministic trends with numbers (in parentheses) indicating deterministic (stochastic) trend growth rates. NBER defined peak-to-trough recession dates shaded gray. Source: BLS and EC via FRED, TradingEconomics, NBER and author’s calculations.
Taking segmented trends literally, US core CPI is growing 0.3 ppts faster than the Euro area, starting from 2021M02 onward.
For more on testing on deterministic, stochastic and segmented trends, see Cheung and Chinn (Oxford Economic Papers, 1996), Cheung and Chinn (JBES, 1997), and Cheung, Chinn and Tran (AEL, 1995).
Update, 8pm Pacific:
2slugbaits points out that HICP and CPI treat implied residential rent differently. I repeat Figure 1, but using US HICP as well as Euro Area HICP.
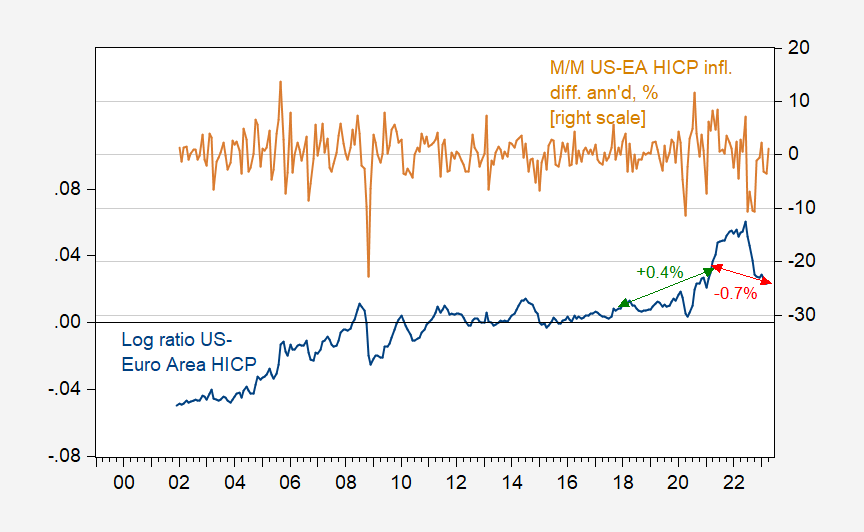
Figure 4: Log ratio of US HICP to Euro Area 19 HICP (blue line, left scale), and month-on-month annualized inflation differential, in % (tan line, right scale). HICP seasonally adjusted using X13 log transform, X11 ARIMA seasonal adjustment. Inflation differential calculated using log first differences. Source: BLS, EC via FRED, and author’s calculations.
The unit root/trend stationary test results are essentially the same as for the CPI/HICP comparison.
From 2018M02-2021M2, the ratio rose +0.4% per year, and from 2021M02-2023M04, it fell 0.7%. For comparison, in Figure 1 (running to 2023M05), the ratio rose +0.8%, then fell 0.8%. Hence, using HICPs for both regions, the shift is slightly smaller.
The UK, on the other hand:
https://fred.stlouisfed.org/graph/?g=169v9
Menzie Question. When comparing the CPI in the US to the Euro Area HICP wouldn’t you have to back out the implied residential rent costs used in the CPI?
2slugbaits: I have been sloppy in the comparisons. I’ll cross-check my results by using US HICP (did this before, but not this time).
LOL
Econned: Analysis redone using HICPs. No big difference in terms of change in inflation rate pre- vs post-.
Menzie Chinn,
I think you meant to reply to 2slugbaits. Sloppy yet again.
Econned: I was responding to both 2slugbaits and your response (“LOL”) to 2slugbaits. That’s how the thread reads to me. So I don’t think sloppy, in this regard.
Menzie Chinn,
1) You literally responded to me by writing “Econned:”.
2) I clearly responded “LOL” to you – look at how the thread responses are indented
3) your response shows that you clearly failed to see why I LOL’d to you
4) please adjust your comment now that your (repeated) sloppiness is spelled out for you
5) at least try. Or don’t – it’s your egg-ridden face.
LOL! Was that the other preK students laughing at you? Come on clown – add value or go far far away.
“The unit root/trend stationary test results are essentially the same as for the CPI/HICP comparison.”
Huh. Hey Econned – why don’t you try to produce some results? Oh wait – the only thing you know how to do is to take a photo of a dinner bill in some African eating establishment. Now that is ADVANCED scientific research!
Wow, that list of us living in your head is growing. 😉
CoRev
June 15, 2023 at 12:18 pm
Hey Econned – you finally have found a friend here. Never mind he is even more disgusting than you are. Try harder a little Econned – we are all counting on you to be even more pointless and repugnant. We know you can do it. Come on boy – go for it.
I find how journalists report or “tell the story” on inflation interesting. I would call this “price gouging” and others call it “corporate profits” https://finance.yahoo.com/news/the-us-is-in-its-third-inflation-wave-and-corporate-profits-may-be-a-major-reason-why-075029030.html
I find the reporting on inflation to be a sloppy mess – the focus on the year-over-year headline inflation number without a chart and context (where it was and trend of where it is going) is confusing and misleading. Also the misunderstanding or lack of context in how inflation is measured – so you get “well egg prices are down but wheat is up” type stories as well as missing the difference between CPI and core CPI.
Thanks for allowing me to post Menzie – just trying to sort this all out.
(I did find the New Yorker article on Isabella Weber very informative and why the debate on her comments were important – https://www.newyorker.com/news/persons-of-interest/what-if-were-thinking-about-inflation-all-wrong)
That greed inflation story was sloppy. These journalists are still quoting the CFO of PepsiCo? Yea he HOPES his company’s profit margin goes back up. After all it fell from 14.3% in 2020 to 13.3% in 2022. Of course these reporters are almost as dumb as JohnH in that they are too stupid to look at the financials for this company. Dudes – learn to use http://www.sec.gov. DAMN!
“well egg prices are down but wheat is up”
Just bought a dozen eggs where prices are only half of what they were a few months ago. Also bought a loaf of bread for a really good price. Of course that I-95 collapse in Philadelphia has me worried.
‘Some of the most distinguished American economists of the 20th century called for a continuation of price controls in the New York Times. This included the likes of Paul Samuelson, Irving Fisher, Frank Knight, Simon Kuznets, Paul Sweezy and Wesley Mitchell, as well as 11 former presidents of the American Economic Association. The reasons they presented for price controls also apply to our present situation.’
Wait – would Krugman suggest Paul Samuelson is stupid? I doubt it. Now the National Review began its disgusting parade of lies by calling Keynes a dangerous commie. And we know Kudlow is the dumbest person walking the face of the earth.
This is the first time I have read what she wrote and it was an interesting discussion.
There is some comfort in seeing that Isabella Weber has gotten a lot more attention, after the original beat down, than she ever had before.
I think it is double hard to challenge new dogma. You are not just shaking peoples foundation – you are shaking the actual people who build that foundation (and in the process their own reputation). That creates a ton of reflective hostility.
Nope, nope. James you’re so screwed up in the head, seriously wrong. You need to find the “orthodox economists” website and cure your mental illness of critical thinking. No independent thinking, please. You can’t do that. You need two crisscrossing lines on a graph and some differential equations before we care what you think James, ok??
Larry Summers says it’s because of crazy American demand. Completely out of control American demand. Americans have so much cash/savings now they have to dump it before their local bank’s digital accounts explode in 1’s and 0’s. Larry Summers calls it the “gonadotropins effect”, or…… in layman’s terms…… “overly impregnated savings”. He says Americans will die if we give them too many jobs or too high of wages. Orthodox economists say (and BTW, it’s not because such a theory matches economists’ corporate masters’ interests of people desperate to get jobs, it “just so happens to harmonize with….”) it’s an illness spreading the land, and only Larry Summers and William Powell can save the great unwashed from this horrific plague.
So, James, next time you’re offered a job or a pay increase, scream out in an emotional way like you’ve been bitten by a rabid dog “NO!!! NO!!! NO G*ddamnit!!!! NO!!! It will raise the price of my Frosted Flakes and then we all die!!!! Aaaaaaahhh!!!” Then calmly go down to your regional FBI headquarters and tell them they need to arrest Isabella Weber yesterday.
James, we’re shooting for an economy where at least 50% of the population is desperate for jobs where they get treated like a piece of shit, eat shit daily with a frozen smile on their face, and take wages substantially lower than the value they give their employers. Larry Summers calls this “The Ideal American Efficiency Equilibrium Point”. It’s rumored that Larry gets super glue in his shorts every time he thinks about it.
*Jerome Powell.
I keep trying to forget the bastard’s name. I was so close for a second there.
‘Some of the most distinguished American economists of the 20th century called for a continuation of price controls in the New York Times. This included the likes of Paul Samuelson, Irving Fisher, Frank Knight, Simon Kuznets, Paul Sweezy and Wesley Mitchell, as well as 11 former presidents of the American Economic Association. The reasons they presented for price controls also apply to our present situation.’
Wait – would Krugman suggest Paul Samuelson is stupid? I doubt it. Now the National Review began its disgusting parade of lies by calling Keynes a dangerous commie. And we know Kudlow is the dumbest person walking the face of the earth.
This is the first time I have read what she wrote and it was an interesting discussion.