Headline and core are both at 0.2% m/m, vs. Bloomberg consensus at 0.3%. Here’s picture of m/m, y/y, and instantaneous (Eeckhout 2023, T=12,a=4).
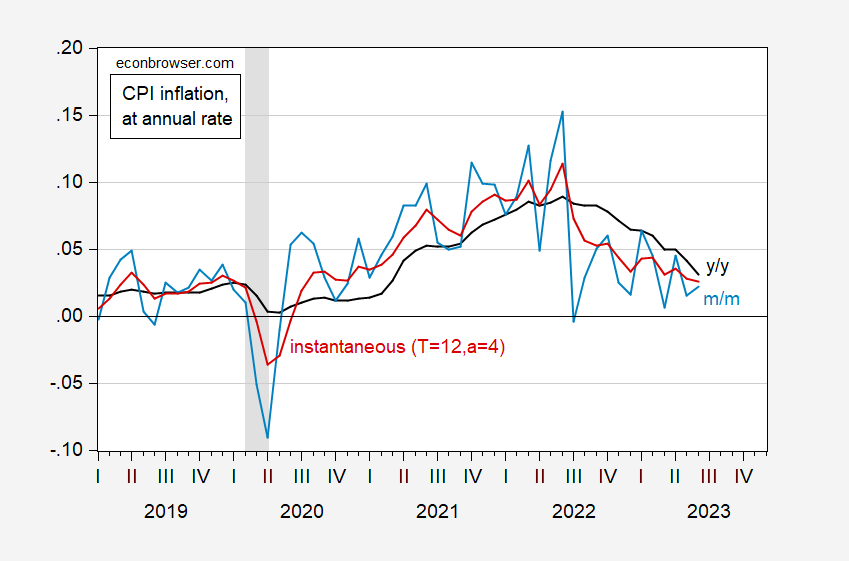
Figure 1: Year-on-year headline CPI inflation (black), month-on-month (light blue), and instantaneous (T=12, a=4) (red). NBER defined peak-to-trough recession dates shaded gray. Source: BLS, NBER, and author’s calculations.
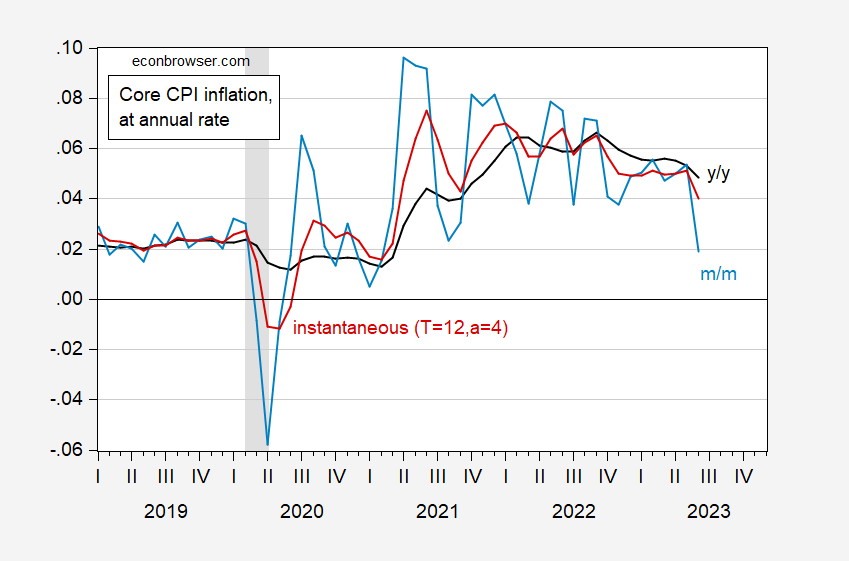
Figure 2: Year-on-year core CPI inflation (black), month-on-month (light blue), and instantaneous (T=12, a=4) (red). NBER defined peak-to-trough recession dates shaded gray. Source: BLS, NBER, and author’s calculations.
So, short horizon movements are in the same direction as the year-on-year that are the focus of popular discussion. The trend as proxied by Eeckhout (2023)‘s measure of instantaneous inflation is the same (downward). Core m/m is 1.9% annualized, while it’s 4% using instantaneous.
For reference, here are the various price indices in levels.

Figure 3: CPI (black), core CPI (gray), PCE deflator (blue), core PCE deflator (light blue), and HICP (red), all in logs 2020M02=0. NBER defined peak-to-trough recession dates shaded gray. Source: BLS, BEA via FRED, NBER, and author’s calculations.
Powell has been, so presumably a majority of FOMC members have been, concerned about service prices. Here’s Services CPI, with and without rent:
https://fred.stlouisfed.org/graph/?g=16Z8T
We’re getting there, with good reason to believe we will continue to make progress. But just for show, the Fed is going g to hike rates again.
prof Chinn, can you please share the formulas for annualizing log CPI and the instantaneous CPI metric. many thanks
macroman: I used the exact formula (x[t]/x[t-1])^12-1 to generate m/m annualized inflation, where x is the price index (not logged). To generate the instantaneous inflation rate for T=12, a=4, I use:
inflcpiyoya4 = (z^4.098698732*z(-1)^2.893954867*z(-2)^1.976610114*z(-3)^1.296853896*z(-4)^0.809619503*z(-5)^0.474584088*z(-6)^0.256168671*z(-7)^0.123538132*z(-8)^0.050601219*z(-9)^0.016010542*z(-10)^0.003162576*z(-11)^0.000197661)-1
where z[t] = (x[t]/x[t-1])
Off topic, fiscal policy and the Court –
Some concern has been expressed here regarding the fiscal position of the federal government. Some comments take a broad approach,noting that both revenue increases and spending restraint represent fixes for the deficit. Others adopt a more partisan position, demanding that spending cuts are the only allowable solution. Others insist that money spent defending Ukraine against Russia’s invasion is especially bad for the budget – for reasons that are never made clear but that most of us have guessed at.
Well, now the Supreme Court has agreed to hear a case questioning the legitimacy of tax law that has been around for about a century. The amount involved in the case is just over $14,000, so it ain’t the money at immedat stake which motivates this case. Rather, the practice of taxing some unrealized gains is the issue here, and also in a number of “tax the rich” notions.
The Supreme Court hasn’t posted any documentation on the case yet, but SCOTUSblog has:
https://www.scotusblog.com/2023/06/justices-take-up-cases-on-veterans-education-benefits-and-16th-amendment/
the second paragraph of this morning’s news release (https://www.bls.gov/news.release/cpi.nr0.htm) reads:
The index for shelter was the largest contributor to the monthly all items increase, accounting
for over 70 percent of the increase, with the index for motor vehicle insurance also contributing.
by the way they compute that 70% contribution from shelter, the contribution from car insurance was 22% of the CPI gain….gasoline contributed another 17%, and electricity contributed 11%…
they’ve been doing that for years, and they use that same method in computing the contributions to the PPI components, so if you read their releases, be aware..
Speaking of inflation, and the Fed, the dollar (as represented by the DXY) has fallen sharply today, apparently in response to the weakness of today’s CPI data:
https://www.tradingview.com/symbols/TVC-DXY/
I’ve already seen commentary suggesting this slide in the dollar will induce worry among FOMC members. So far today, markets are pricing in slightly higher odds of a 25 basis point Fed hike than yesterday or a week ago:
https://www.cmegroup.com/markets/interest-rates/cme-fedwatch-tool.html
So assuming the only factors at work are the CPI report and the dollar’s weakness, then dollar weakness wins.
https://www.cmegroup.com/markets/interest-rates/cme-fedwatch-tool.html
CoRev is once again making a fool out of himself on soybean economics. He does realize that soybean prices rose a lot after Biden became President but of course he has no clue as to why:
https://www.fas.usda.gov/data/2021-us-soybean-outlook-remains-strong-after-record-first-quarter-export-volume#Decade-Low%20Soybean%20Exports%20in%20First%20Quarter%20of%202020
In the first quarter of 2021, U.S. soybean exports reached the second-highest value ever at $7.7 billion, nearly double the same period last year. This growth was driven by record first quarter export volumes coupled with high prices, which have been climbing steadily during the past year. Export volumes are up substantially due to the rebound of trade with China owing to the removal of retaliatory tariffs, the rebuilding of the swine herd from African swine fever (ASF), and a delayed South American harvest extending the U.S. selling window. Export values were further supported by U.S. soybean prices increasing to 7-year highs on strong China purchases, high corn prices, and tight supplies in the United States and South America. Building off record first quarter export volumes, 2021 is poised to be an excellent year for U.S. soybeans. Aided by sustained high prices and growing trade with major markets outside of China, such as Egypt and Mexico, export values are likely to remain strong throughout the year. However, facing expanding domestic crush, smaller carrying, high prices, and a record crop in Brazil, U.S. soybean export tonnage is unlikely to match last year’s record. With sustained high prices and growing global consumption, 2021 is likely to be another strong year for U.S. soybean exports.
Ole Bark, bark finds another lying source. The lie from his USDA : “…Export volumes are up substantially due to the rebound of trade with China owing to the removal of retaliatory tariffs, the rebuilding of the swine herd from African swine fever (ASF), and a delayed South American harvest extending the U.S. selling window….” yup! USDA claims that the soybean tariff was raised by Biden, but as late as Wed March 23, 2022 CNN wrote this: “… But China failed to meet purchase targets it had promised under what’s known as the Phase One agreement, which was signed by then-President Donald Trump and Chinese President Xi Jinping, falling more than $213 billion short of its commitment. Biden suggested earlier this year that’s the reason he’s leaving the tariffs in place. ”
And as late as Feb 09, 2022 CNN also said this specifically about China and soybeans: “…but they still fell short of China’s commitment. Soybeans, for example, fell more than 30% short of the target. The Trump administration made about $28 billion in aid payments to help farmers hurt by the tariffs stay afloat. ” https://www.cnn.com/2022/02/08/politics/trump-china-us-trade-phase-one-deal/index.html
So who are we to believe, the biggest troll on this blog, or CNN quoting the Prez? Clearly the 2021 USDA claim that soybean tariffs were already lifted is NO TRUE. I dunno. Does this qualify for misinformation?
The lying, trolling, and naive liberal mind is an amazement. This troll who lies all the time is an embarrassment.
Let’s go back to last summer when the 5-Year Breakeven Inflation Rate was near 3%. What kind of BS did we see back then. Well there was Bruce Hall trying to tell us that inflation was near 13%. Yea Brucie got called out on that nonsense. But we also had JohnH insisting that anyone who was forecasting inflation might be a mere 3% was insane.
Well the market measure was forecasting 3% inflation. How dumb was that? Well actual inflation over the 12 months since then was …. drum roll …. 3%!