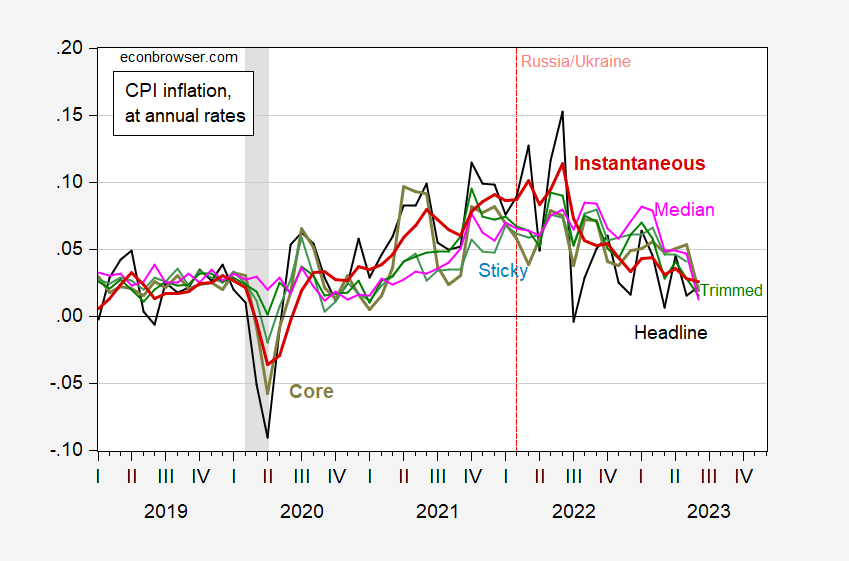
As of June:
Figure 1: Month-on month CPI inflation (black), core (bold chartreuse), sticky price (light blue), 16% timmed (green), median (pink), and instantaneous (T=12, a=4) (bold red), all at annual rates. NBER defined peak-to-trough recession dates shaded gray. Source: BLS, Atlanta Fed, Cleveland Fed, NBER, author’s calculations.

Sure looks whipped to me. Crazy that the Fed is probably hiking again this month while earlier FFR increases continue to flow through.