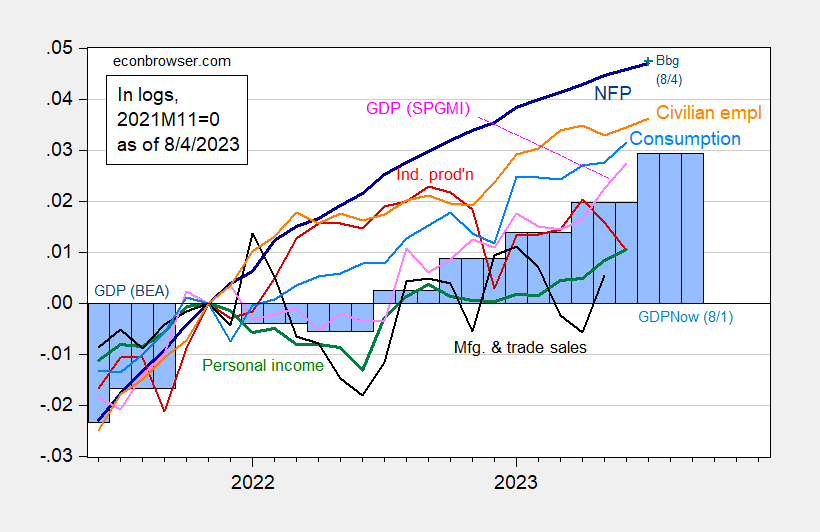
Continued, albeit slowing, employment growth yields the following picture of key variables followed by the NBER’s Business Cycle Dating Committee (plus monthly GDP, and GDPNow).
Figure 1: Nonfarm payroll employment, NFP (dark blue), civilian employment (orange), industrial production (red), personal income excluding transfers in Ch.2012$ (green), manufacturing and trade sales in Ch.2012$ (black), consumption in Ch.2012$ (light blue), and monthly GDP in Ch.2012$ (pink), GDP (blue bars), 2023Q2 is GDPNow of 8/1, all log normalized to 2021M11=0. Source: BLS, Federal Reserve, BEA 2023Q2 advance release via FRED, S&P Global/IHS Markit (nee Macroeconomic Advisers, IHS Markit) (8/1/2023 release), and author’s calculations.
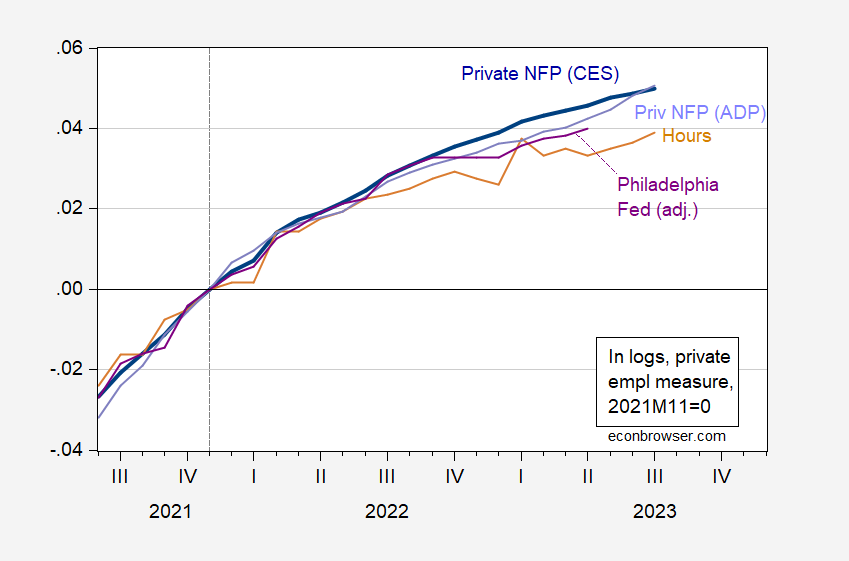
As mentioned in this post on the employment situation release, there is some worry that the official CES series is overstating employment. In Figure 2, I show some alternative measures of employment activity (including hours).
Figure 2: Private nonfarm payroll employment from CES (bold blue), from ADP (lilac), aggregate hours from CES (tan), from Philadelphia Fed early benchmark (purple), all in logs 2021M11=0. Philadelphia Fed calculated by subtracting CES government employment from Philadelphia Fed early benchmark. Source: BLS, ADP via FRED, Philadelphia Fed, and author’s calculations.
Note that all the series are trending up through April, although some much less than others. The ADP and BLS series have grown by the percentage since 2021M11. On the other hand, hours are have grown less than employment (3.9% vs. 5%).

