Today we are pleased to present a guest contribution by Jamel Saadaoui (University of Strasbourg). This post is based on the paper coauthored with Valérie Mignon (University of Paris Nanterre).
Introduction
The last two decades have been characterized by impressive changes in the oil market at the global level. Although the role of the Chinese economy in the oil market was negligible before China’s entrance into the WTO, the situation dramatically evolved afterward. Indeed, China has become a significant player in the oil market, with 16.4% of global consumption in 2021. Turning to the US, it is the first largest consumer (19.9% of world oil consumption) and producer (16.8% of world oil production). Given the weight of these two countries, the evolution of their political relationships could thus strongly affect the dynamics of oil prices, in addition to geopolitical risks.
This paper tackles this issue by investigating the impact of political tensions and geopolitical risks on oil prices. Whereas various articles have tried to capture these effects using proxy variables (Chen et al., 2016; Lee et al., 2017; Miao et al., 2017; Perifanis and Dagoumas, 2019; Abdel-Latif and El-Gamal, 2020; Qin et al., 2020; Caldara and Iacoviello, 2018), Cai et al. (2022) is the first study that relies on a quantitative measure of political relations to investigate their possible impacts on oil prices.
In the present paper, we go further than the previous literature by relying on two complementary quantitative measures. First, we use an index built by the Institute of International Relations at Tsinghua University to measure political relationships for China and its major trade partners (see Yan (2010) for a discussion). This Political Relationship Index (hereafter PRI), ranging between -9 and 9, indicates whether the countries are rivals (between -9 and -6), in a tense relation (between -6 and -3), in a bad relation (between -3 and 0), in a normal relation (between 0 and 3), in good relation (between 3 and 6), and friends (between 6 and 9). PRI fluctuates according to a scale similar to the Goldstein scale (Goldstein, 1992). Each month, bad or good events appearing in People’s Daily and on the Chinese Ministry of Foreign Affairs website are included to update the index. As shown in Figure 1, the US-China political relationships dramatically deteriorated after the beginning of Trump’s trade war.
Second, we use the bilateral version specific to China of the Geopolitial Risk Index (hereafter GPR) introduced by Caldara and Iacoviello (2018). GPR is a monthly index obtained by running automated text searches on the electronic archives of 11 newspapers that counts the percentage of articles related to adverse geopolitical events (wars, terrorist attacks, tensions between countries, etc.). The bilateral version of GPR refers to the percentage of articles in US newspapers dealing with adverse geopolitical events that concern one specific country, namely China in our case. This bilateral index uses three US newspapers: The New York Times, Chicago Tribune, and The Washington Post. As shown in Figure 1, the percentage of articles associated with China increased substantially after Trump’s trade war began.
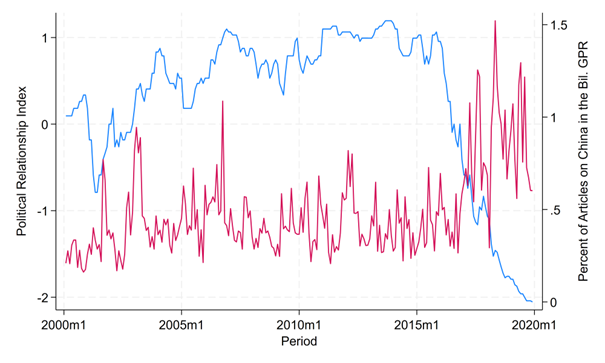
Figure 1: Political Relationship Index (left-hand scale) and Geopolitical Risk Index (right-hand scale)
Notes: PRI (in blue) can be downloaded at: http://www.tuiir.tsinghua.edu.cn/imiren/info/1091/1320.htm, and the bilateral GPR (in red) at: https://www.matteoiacoviello.com/gpr_country.htm. PRI is expressed as sign() ∗ (|| + 1) and ranges between -2.30 and 2.30: rival countries between -2.30 and -1.95, in a tense relation between -1.95 and -1.39, in a bad relation between -1.39 and 0, in a normal relation between 0 and 1.39, in good relation between 1.39 and 1.95, and friends between 1.95 and 2.30. PRI, Political Relationship Index; GPR, Geopolitical Risk Index.
In order to analyze the impact of the US-China political relations on the oil market, the bilateral GPR index specific to China and the PRI index can be seen as complement. Indeed, the bilateral GPR does not focus on the relation between the US and China, rather it provides an overall picture of the geopolitical uncertainty for China. For example, the Sino-Japanese dispute over the Diaoyu/Senkaku Islands could be included in the GPR index specific for China, but it will be included in the Sino-Japanese PRI, not in the PRI for the relation between US and China. The PRI for the US and China is focused on the bilateral relationship. In this respect, we contribute to the literature on the macroeconomic consequences of geopolitical risks (see Caldara and Iacoviello, 2022) by considering the bilateral political relationships between the US and China. We analyze the possible complementarities between the PRI and the GPR index.
Methodology and baseline results
Using monthly data from January 2000 to December 2019, we run SVAR and LP analyses (Jordà, 2005) to evaluate how oil prices react to shocks on PRI and on the bilateral GPR index. We consider the following variables in the SVAR model: bilateral GPR for China (gpr_cn), oil supply (global oil production, million barrels/day, lpro), oil demand (OECD and six major non-member economies (Brazil, China, India, Indonesia, the Russian Federation, and South Africa) industrial production, ldem), oil prices (real WTI spot price, lrpo), and PRI between China and the US (lpri_us), respectively. These oil-related variables are transformed into natural logs. For PRI, we use the log-modulus transformation, which is defined for zero and negative values. All the oil-related variables are taken from Christiane Baumesiter’s personal website (Baumeister and Hamilton, 2019). We use the same variable ordering as in Cai et al. (2022)
In the following, we will focus on the baseline results for the oil prices and on two specific geopolitical events, namely (i) the US bombing of the Chinese embassy in Belgrade and (ii) the 1989 Tiananmen Square events.
Unanticipated negative shocks (deterioration of political relations) are more frequent during Trump’s trade war. Similarly, we observe a rise in the frequency of unexpected positive shocks (an increase in articles related to China in US newspapers) during the same trade war period.
In Figure 2, the LP’s dynamic multipliers show that improving political relations positively affects the real price of oil after 13 months; this positive effect lasting about 10 months. Turning to the VAR’s dynamic multipliers, we observe (i) an initial drop that is not significant in LP, and (ii) the absence of a significant positive effect. Overall, LP seems to capture the short-run dynamics. These results are rather intuitive. An unanticipated improvement in PRI for the US means a better relationship between the two major players in the world economy and in the oil market. Positive shocks on PRI are thus linked to the demand side and are associated with optimistic expectations regarding future economic activity, driving up oil prices.
In Figure 3, we consider the structural shocks in GPR for China. The LP’s dynamic multipliers results are very similar to those related to PRI for the US. Indeed, we observe a rise in the real price of oil after 8 months. This increase lasts around 18 months and is of higher magnitude than the shocks on PRI for the US. Regarding the VAR’s dynamic multipliers, the increase is not significant, as in Figure 2. Our result that higher geopolitical risks drive up oil prices persistently is in line with the fact that there is a tendency to confound all geopolitical tensions with oil supply shocks provoked by geopolitical tensions in the Middle East (Caldara and Iacoviello, 2022). Positive shocks on GPR are thus linked to the supply side and reflect fears of oil supply disruption, pulling up oil prices.
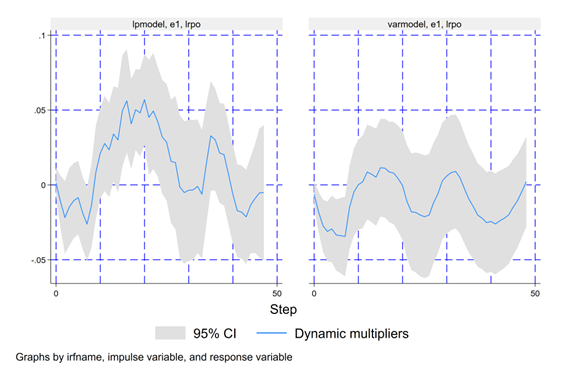
Figure 2: Dynamic Multipliers for the Real Price of Oil (Shock on PRI for the US)
Notes: Left graph: LP, right graph: SVAR. As shown by Cai et al. (2022), the results are robust to different orderings. The real price of oil and the series of structural shocks on PRI for the US are uncorrelated. PRI, Political Relationship Index.
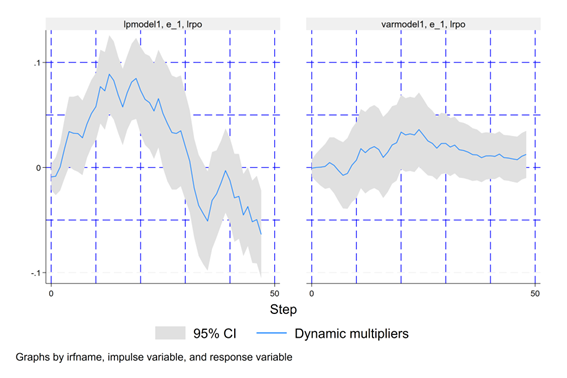
Figure 3: Dynamic Multipliers for the Real Price of Oil (Shocks on GPR for China).
Notes: Left graph: LP, right graph: SVAR. As shown by Cai et al. (2022), the results are robust to different orderings. The real price of oil and the series of structural shocks on GPR for China are uncorrelated. GPR, Geopolitical Risk Index.
US bombing of the Chinese embassy in Belgrade
In the following, we will run the same analyses with samples from February 1990 after the 1989 Tiananmen Square Events, and from February 1985 where the recent GPR index is available. The results are largely similar, but they offer some evidence about the complementarity between the GPR and PRI index in the understanding of the macroeconomic consequences of geopolitical risk. We start with the sample after the 1989 Tiananmen Square Events. The sample starts now from January 1990. We will focus on a specific event that has not been reported and perceived in the same in the US and in China. Indeed, on May 7, 1999, the Chinese embassy in Belgrade was bombed by the US during the NATO bombing of Ex-Yugoslavia, as reported by Ponniah and Marinkovic (2019). As shown by Bondarenko et al. (2023), geopolitical risks cannot be universally measured. In a case study on Russia, they show that geopolitical risk shocks identified from English-language news sources do not have any impact on the Russian economy, whereas Russian-language news sources do have an impact on the Russian economy.
This huge negative shock can only be seen in the PRI index. This important negative event has not been reported in the same way in the US press (Parsons and Xiaoge, 2001) and, thus, stay invisible in the GPR index. The results are largely similar. In the LP’s dynamic multipliers for the PRI, the increase in the oil price comes a little bit later, after 22 months, and lasts 10 months as in the baseline results. The VAR’s dynamic multipliers for the PRI provides a similar dynamics. Besides, the results are very similar for the GPR index.
1989 Tiananmen Square events
Now, we start the sample for January 1985 where the recent GPR index is available. We will focus on the 1989 Tiananmen Square events that took place between 15 April and 4 June 1989. We cannot observe the same discrepancy between the bilateral GPR and the PRI for the relationship between US and China, that we observe for the United States bombing of the Chinese embassy in Belgrade. The rationale behind these results is simple. Indeed, the international media coverage of the Tiananmen Square events is in line with the perceived deterioration in China of the relation with the US.
The results of the dynamic multipliers are qualitatively similar. As the estimation period is longer, we can note some differences in the LP’s and VAR’s dynamic multipliers for the real price of oil for the PRI. The increase in the oil price is obtained after 28 months and is shorter than in the baseline. This last result is interesting, as before the 1990s, the Chinese economy has not a large influence on the world economy. Besides, the results for the GPR are very similar to the baseline results. After the shock, the increase in the real price of oil comes a little bit later (10 months after the shock versus 8 months in the baseline) and lasts longer (22 months against 18 months in the baseline).
Considering the COVID pandemic
Now, we will consider the effect of the COVID pandemic by expanding our sample to January 2022. We stop our sample in January 2022, before the start of the war in Ukraine. As underlined by Baumeister (2023), the pandemic and the Russian invasion of Ukraine may have long-lasting effects on the global energy landscape. Of course, the results of this peculiar sub-sample analysis should be taken with a grain of salt, as the COVID outbreak constitutes a huge, and short-lived, structural break in many macroeconomic time-series. However, it could be interesting to investigate how the model behaves when we include the COVID period.
The PRI index between the US and China has not known any major shock during the COVID. The relation was in rival state and remained stable. On the contrary, the GPR index has known several shocks. This gap is explained by the more general nature of the GPR index. As mentioned before, the GPR index captures the mention of the geopolitical risk relative to China, but is not focused on the bilateral relation between China and the US. The effects on the oil price dynamics are qualitatively similar.
The results are very similar to those in with the sample that starts from January 1985 and stops in December 2019. The increase in the oil price is obtained after 28 months and is shorter than in the baseline. Besides, the results are in line with baseline. The increase in the real price of oil lasts even longer (22 months against 18 months in the baseline).
Conclusion
The results converge toward a positive causal influence of bilateral political relationships between China and the US, and geopolitical risks for China over the short-to-medium run. However, these two quantitative measures are not fully substitutable, as they measure different dimensions of geopolitical relationships. As noted by Bondarenko et al. (2023), the perception of geopolitical risk in each country may matter to measure the influence of these risks on the economy. This last point has been illustrated with the US bombing of the Chinese embassy in Belgrade. Besides, the PRI is more focused on the bilateral relation between China and the US and reflects expectations on the world demand for oil. The GPR index for China is more general and reflects fears of supply disruptions.
Bibliography
Abdel-Latif, H. and El-Gamal, M. (2020), ‘Financial liquidity, geopolitics, and oil prices’, Energy Economics 87, 104482.
Baumeister, C. (2023), Pandemic, war, inflation: Oil markets at a crossroads?, Working Paper 31496, National Bureau of Economic Research. URL: https://www.nber.org/papers/w31496
Baumeister, C. and Hamilton, J. D. (2019), ‘Structural interpretation of vector autoregressions with incomplete identification: Revisiting the role of oil supply and demand shocks’, American Economic Review 109(5), 1873– 1910.
Bondarenko, Y., Rottner, M. and Schüler, Y. (2023), Geopolitical risk perceptions, Technical report, CEPR Discussion Papers. URL: https://cepr.org/publications/dp18123
Cai, Y., Mignon, V. and Saadaoui, J. (2022), ‘Not all political relation shocks are alike: Assessing the impacts of US–China tensions on the oil market’, Energy Economics 114, 106199.
Caldara, D., Conlisk, S., Iacoviello, M. and Penn, M. (2023), ‘Do geopolitical risks raise or lower inflation?’, Technical report.
Caldara, D. and Iacoviello, M. (2018), Measuring geopolitical risk, Technical report, Board of Governors of the Federal Reserve System. URL: https://doi.org/10.17016/IFDP.2018.1222r1
Caldara, D. and Iacoviello, M. (2022), ‘Measuring geopolitical risk’, American Economic Review 112(4), 1194–1225.
Chen, H., Liao, H., Tang, B.-J. and Wei, Y.-M. (2016), ‘Impacts of OPEC’s political risk on the international crude oil prices: An empirical analysis based on the SVAR models’, Energy Economics 57, 42–49.
Goldstein, J. S. (1992), ‘A conflict-cooperation scale for WEIS events data’, Journal of Conflict Resolution 36(2), 369– 385.
Jordà, Ò. (2005), ‘Estimation and inference of impulse responses by local projections’, American Economic Review 95(1), 161–182.
Lee, C.-C., Lee, C.-C. and Ning, S.-L. (2017), ‘Dynamic relationship of oil price shocks and country risks’, Energy Economics 66, 571–581.
Miao, H., Ramchander, S., Wang, T. and Yang, D. (2017), ‘Influential factors in crude oil price forecasting’, Energy Economics 68, 77–88.
Parsons, P. and Xiaoge, X. (2001), ‘News framing of the Chinese embassy bombing by the People’s Daily and the New York Times’, Asian Journal of Communication 11(1), 51–67.
Perifanis, T. and Dagoumas, A. (2019), ‘Living in an era when market fundamentals determine crude oil price’, The Energy Journal 40(SI), 317–335.
Ponniah, K. and Marinkovic, L. (2019), ‘The night the US bombed a Chinese embassy’, BBC News. URL: https://www.bbc.com/news/world-europe-48134881
Qin, Y., Hong, K., Chen, J. and Zhang, Z. (2020), ‘Asymmetric effects of geopolitical risks on energy returns and volatility under different market conditions’, Energy Economics 90, 104851.
Yan, X. (2010), ‘The instability of China–US relations’, The Chinese Journal of International Politics 3(3), 263–292.
This post written by Jamel Saadaoui.
https://www.msn.com/en-us/news/us/ny-times-columnist-says-gop-ignoring-climate-change-to-offend-the-elites-sign-of-political-machismo/vi-AA1eQmM0?ocid=msedgdhp&pc=U531&cvid=4af106255dd84780b4e283e09d0086bc&ei=13
I have never been a fan of David Bobo Brooks but he has a point. Republicans are opposed to dealing with climate change simply because that ticks off liberals. Prime example – the babbling from CoRev.
ticks off liberals seems to be an enjoyable pastime,
which like ticks off deplorables for some
This paper looks like an example of what a great deal of political economy writing will be like for years to come. There is, of course, the rest of the world. Sometimes ROW will need a place in the analysis, sometimes not.
Absolutely, and the strategic alliances will change and develop in future years, as mentioned in our previous paper: https://doi.org/10.1016/j.eneco.2022.106199
“Overall, our findings show that conflicting relationships between these two major players in the oil market may have crucial impacts, such as the development of new strategic partnerships.”
Not crazy about this thesis. Not at all. The oil markets are so vastly different today than they were in, say, 1989.
We can say this: China has been the key driver of demand growth in the last 20 years. If China is performing well, demand will be strong and oil prices will tend to be higher, ceteris paribus. Of course, ceteris is not always paribus. The rise of shales is a case in point.
Btw, if we include NGLs, the US produces 20.7% of the world’s oil and consumes 20.2% of the world’s oil. There’s a semantic discussion of whether NGLs are really oil, but as a functional matter, they are.
Our sample starts in January 2000 in the paper: https://dx.doi.org/10.2139/ssrn.4456924. We can include the NGL to identify the shock in the first step, but we need a series that starts in January 2000.