It seems a lot less uncertain since 2021M01.
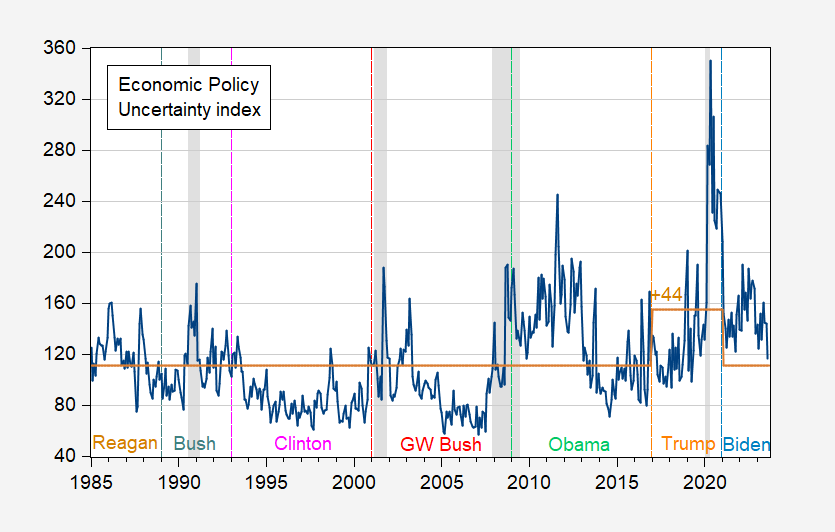
Figure 1: Economic Policy Uncertainty (news based) [correction 9/25 11:15am] Index (blue), and average value with Trump dummy (tan). NBER defined peak-to-trough recession dates shaded gray. Source: policyuncertainty.com, NBER, and author’s calculations.
The Trump administration is characterized by 44 point higher EPU. Adding in a dummy variable for the Covid period (2020M02 onward) would reduce the estimated coefficient on the Trump dummy to 33.5 (statistically significant in both cases).
Update, 9/25, 11:20AM Pacific:
Reader Econned points out an error in the legend to figure 1, which I have now corrected. I replace the 3 factor version of EPU to generate Figure 2 below.

Figure 2: Economic Policy Uncertainty (news based) Index (blue), and average value with Trump dummy (tan). NBER defined peak-to-trough recession dates shaded gray. Source: policyuncertainty.com, NBER, and author’s calculations.
The coefficient on the Trump dummy is now 48 (p-value using HAC corrected Newey West standard errors under EViews default is 0.137).
Would a dummy variable for he housing/mortgage hiccough also be useful?
Lines up very nicely with your VMT analytics. And it clearly shows recessions, a depression and suppression.
If you’re wondering about why conservatives dislike experts, note the orange line. Clearly, uncertainty in the first half of the Obama administration was very high, and that would deserve its own elevated orange line, as you have put in for Trump. Curiously, uncertainty has been quite elevated under Biden as well, when really it should have been lower, I think. But you understand, perhaps, that your analytics would be interpreted by conservatives as biased and untrustworthy. This is their beef with the MSM. You may think you’re being neutral and analytical, Menzie, but any conservative reader would interpret you as biased and advocating for the left. (It’s why fascists burn books when given the chance.)
Meanwhile, Biden is down 52-42 to Trump in the polls. And this does not get better, with JPM now forecasting oil rising to as high as $150 / barrel next year, barring a recession. If that happens, Biden will be out, I think, regardless of whom the Republicans present as their candidate. I think this may also help you to understand my grave misgivings with the Price Cap as it was designed and implemented.
https://markets.businessinsider.com/news/commodities/oil-prices-rise-high-150-barrel-opec-underinvestment-tight-supply-2022-10#:~:text=Oil%20prices%20could%20skyrocket%20to%20%24150%20a%20barrel,barrel%20next%20year%20in%20event%20of%20a%20recession.
https://abcnews.go.com/Politics/story?id=103436611
“And it clearly shows recessions, a depression and suppression.”
Stevie is still living in his own made up reality. Yea we are all of YOUR league. Your league is akin to One Flew Over the Cuckoo’s nest.
“uncertainty in the first half of the Obama administration was very high”
Gee little Stevie never heard of the Great Recession. Which I guess his “suppression” model blamed on Obama.
You know – I get a good chuckle at reading your comments. They may be stupid as it gets but they are still a laugh riot!
Stevie read this as claims JPMorgan’s forecast is for oil to hit $150 a barrel? “with JPM now forecasting oil rising to as high as $150 / barrel next year”
‘Oil prices could skyrocket to $150 a barrel next year, and underinvestment in the industry could mean tight supply for the next decade, a JPMorgan energy strategist warned. The bank estimates that oil could stick around $80 a barrel next year in event of a recession. But if supply grows tight, prices could easily soar to $150 a barrel, based on factors like OPEC+ falling short of its production targets, slowing US shale production, and rising demand for oil.’
Maybe Stevie has never heard of probability weighted forecasts but I would not put that the probability of the $150 a scenario at 100%. Yes – Stevie is the world’s worst consultant.
And of course Stevie told me he never said oil prices would reach $200 a barrel. Yea – he did, Many times. In fact in something he wrote back in 2009 he said oil prices might even reach $500 , But Stevie has to deny his own forecasts as they are beyond laughable.
So, one guy makes a forecast, and that’s tha basis of your argume t? And you accuse “experts”, or is it “liberals”, of bias. Get a clue.
Yes, policy uncertainty accompanies recessions. What did you expect? Depression is just an outmoded term for recession, sometimes used to suggest a bad recession, and suppression is a made-up term with no objective meaning, so we’ll ignore them.
Interesting that you’ve cited an ABC poll which even the pollsters have acknowledged is an outlier – and that you’ve added a point to Trump’s number in the process. But that’s how Fox rolls, and you do love getting on Fox.
I’m amused at your “should”, claiming that policy uncertainty “should” be lower. If one’s preference is for no change in policy from the Trump presidency, then obviously policy “should” not change, limiting uncertainty. The results of the 2020 election indicate a desire for change among voters. Only if one believe voters’ preferences “should” be disregarded is one likely to think policy uncertainty “should” have been lower.
Speaking of dislike for election consequences, it’s interesting to see you excusing book burning and fascism. I know they’ve become fashionable again in some circles. Mostly conservative circles, obviously. Again, I suppose this helps over at Fox News.
Anybody notice the Newsmax lawsuit? The one in which Newsmax is accused of lying about voting machines, just the way Fox did. Fox was found guilty of lying. Stevie fits right in.
Read on. This guy did not say oil will be $150 a barrel. No – that was one possibility. I guess Stevie does not know what probability weighted forecasts even are.
Peak Shale?
https://www.princetonpolicy.com/ppa-blog/2023/9/23/rigs-and-spreads-sept-22-peak-shale
Totally irrelevant for this post. Totally worthless blog post in general. Par for the course.
It appeared there was a great article on shale in NYT today but I couldn’t get past the firewall. I’d be thankful if anyone knows of an ulterior link.
Menzie Chinn,
There’s a lot to unpack here. Where to start?
1) for clarity, it should be stated that you’re using the 3 component uncertainty index and not the news based uncertainty index. Not that either is ‘right’ or ‘wrong’, it’s just that I see where you label the series in Figure 1 as “Economic Policy Uncertainty (news based)” but, based on my replicating your reported results, it looks as if you’re using the 3 component which does include the news but includes 2 additional components.
2) a model with an Obama dummy yields a coefficient estimate of 31.2 (statistically significant) when used alongside a COVID dummy (per your definition) – I would venture to say that this difference is negligible when compared to the Trump dummy coefficient of 33.5
3) your specification of COVID dummy running from 2020M02 onward seems suspect. This modeling is an attempt to quantity the correlation of administrations and/or COVID with economic policy uncertainty. Instead, I ran a model specifying COVID as 2020M02-2022M02. These dates were selected by analyzing CDC’s statistics of US monthly COVID deaths. This series show 2022M03 as the month when a noticeable leveling off occurred followed by a sustained period of relatively low deaths (not to diminish any level of deaths). Given the vaccines, etc I think it’s incorrect to keep COVID dummy as “1” in perpetuity which is what you seemingly decided as appropriate.
4) using the updated COVID dummy I reran the models. The model with a Trump dummy yields a statistically significant 28.8 and the model with Obama yields a statistically significant 28.5 – I would venture to say that this difference is negligible
4a) a (non-COVID) multivariate model with dummies for Obama and Trump yield coefficients of 29.2 and 50.7 respectively.
4b) a model with a dummy for Obama, Trump, and the updated COVID yields presidential coefficients of 32.3 for Obama and 35.3 for Trump – I would venture to say that this difference is negligible
4c) a model including each POTUS (sans Clinton) alongside the new COVID variable yields coefficients of 33.4 25.8 11.3 48.2 54.4 38 by order of presidency.
5) but now let’s circle back to your COVID variable of 2020M02 – forever and model that alongside a dummy variable for each president (again, dropping Clinton). Coefficient estimates are 33.4 25.8 11.3 48.2 39 -61 by order of presidency (for those lacking initiative, this shows the Obama administration as having the highest estimated coefficient with each being statistically significant). Modeling this way also suggests the Biden administration as being correlated with the lowest economic uncertainty (by far) on record dating back to 1985 – I would venture to say such a result, and the associated modeling, is dubious.
6) now let’s model the data using each POTUS during 1985M01-2020M01 to exclude COVID. The following coefficient estimates by POTUS equal 33.4 25.8 11.3 48.2 39.0 (again omitting Clinton). This shows Obama administration as being correlated with the highest uncertainty.
7) none of this is to say these approaches are perfect – from the modeling to the data used (I can hear conservatives complaining about news bias, etc). None of this is to say Trump handled COVID well. None of this is to say Trump’s approach didn’t exacerbate economic uncertainty. None of this is to say Trump is preferable (or not). None of this is to say congress doesn’t matter. None of this is to say we should ignore COVID in such analyses. (And all the other “yeah but…” that the Menzie army will undoubtedly proclaim). Hell, I’m surprised that this uncertainty measure during Obama’s tenure rivaled (much less exceeded) Trump’s. It’s only to say that our host isn’t being honest in his analyses. It’s very much Trump-like. Again.
Addendum:
POTUS coefficient estimates with models including a recession dummy. Results are in order of presidency and omit the Clinton administration…
1) Menzie COVID with recession:
33.4 20.2 5.1 46.1 39 -55
2) Econned COVID with recession:
33.4 19.7 4.6 45.9 53.7 39.4
3) 1985M01-2020M01 with recession:
33.4 20.2 5.1 46.1 39.0