Does an error correction model of the Divisia M4 quantity theory or a old style expectations and supply shock augmented Phillips curve fit the post 2019 period better (using 1998-2019 data)? Answer: The Phillips curve works better.
To be fair to the Quantity Theory, I test for cointegration between PCE deflator and M4 divisia divided by GDP (hence imposing a unit coefficient on GDP). The Johansen maximum likelihood approach usually detects cointegration. I then estimate an error correction model:
Δpt = 0.114 – 0.016(p-m+y)t-1 + 0.224Δpt-1 – 0.001Δmt-1 + 0.222Δyt-1
Adj-R2 = 0.13, SER = 0.0036, DW = 1.90, NObs = 88
and Phillips curve:
Δpt = 0.002 + 0.020(y-ypot)t-1 + 0.077πet-1 + 0.0008gscpit-1 + 0.0009gscpit2 + 0.019Δpoilt + 0.006Δpoilt-1
Adj-R2 = 0.69, SER = 0.0021, DW = 1.98, NObs = 88
Where p is the log PCE deflator, Δp is q/q inflation, m is log M4M divisia, y is log real GDP, ypot is potential GDP (CBO), πe is Michigan expected inflation, Δpoil is q/q growth rate of oil prices, and gscpi is the NY Fed Global Suppy Chain Pressure Index.
Note that the quantity theory/divisia model estimates make some sense. The statistically significant and negative coefficient on the error correction term indicates that the price level reverts to restore equilibrium in the long run, at about 1.6% per quarter. (Interestingly, GDP and money both revert at a faster pace than prices.)
The Phillips curve fit is much better, with an adj-R2 of 0.69. The output gap enters with a significant and positive coefficient. Expected inflation also enters, along with oil prices.
How do the two empirical models compare? The out-of-sample forecasts (strictly speaking, two ex post historical simulations, since the right hand side variable are taken as given).
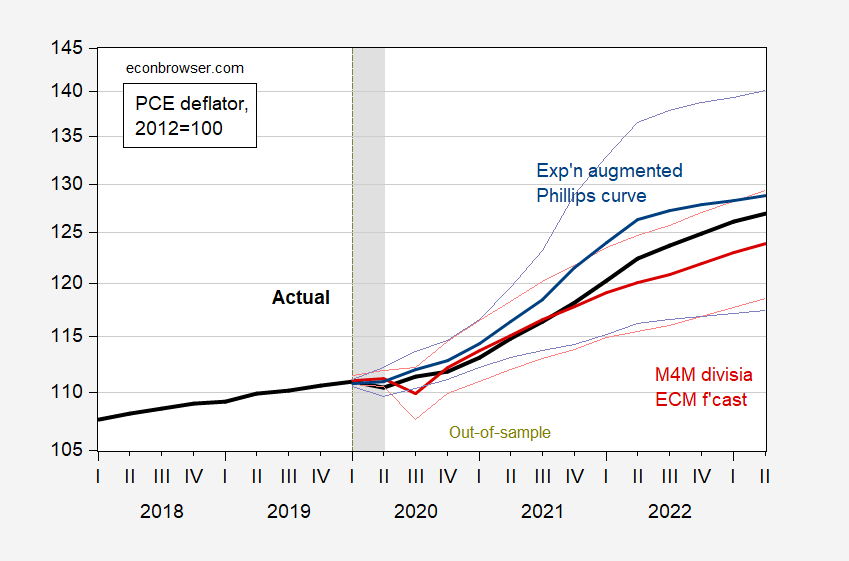
Figure 1: PCE deflator (bold black), quantity theory/divisia model (red), plus/minus one std error band (pink lines), expectations and cost-push shock augmented Phillips curve model (blue), plus/minus one std error band (light blue lines), all 2012=100. NBER defined peak-to-trough recession dates shaded gray. Source: author’s calculations.
In other words, the Phillips curve actually predicts the price level well, contrary to assertions that inflation was not well predicted. In point of fact, if one had known that oil prices were going to rise especially in early 2022, and supply chain pressures were to be elevated in 2021, then the persistence of inflation would have been unsurprising.
Addendum, 9/1:
Reader Econned wants summary statistics for the out-of-sample forecasts. Here they are:

The forecasts are shown, as is the actual realizations. One can easily eyeball that (1) the Phillips curve overpredicts, and (2) the quantity theory/divisia ECM underpredicts, and (3) forecasted level in 2023Q2 is closer to actual for Phillips curve. Formally, RMSFE is smaller for the Phillips curve, while MAE is larger. The latter is more appropriate if one things the variance of errors is infinite.
https://www.bls.gov/news.release/empsit.nr0.htm
THE EMPLOYMENT SITUATION — AUGUST 2023
Total nonfarm payroll employment increased by 187,000 in August, and the unemployment rate rose to
3.8 percent, the U.S. Bureau of Labor Statistics reported today.
Decent rise in the payroll survey figure. Now I’m waiting for the usual morons to fret over the rise in the unemployment rate. Of course the household survey showed employment growth = 222 thousand with the employment to population ratio remaining constant.
Yes boys and girls, the rise in the reported unemployment rate was due to a rise in the labor force participation rate.
Let’s see how many morons don’t check these figures out before freaking out that the reported unemployment rate rose.
https://www.msn.com/en-us/news/politics/brian-kemp-ignites-republican-civil-war-in-georgia/ar-AA1g6jmw?ocid=msedgdhp&pc=U531&cvid=e65329f1bee546f7a123a3d1b2b8c252&ei=5
The governor of Georgia rejects the MAGA wing of his party. Good for him.
This is the same deal as the main Methodist Church right now, deciding they will allow homosexual ministers and will now perform homosexual marriages. And why Catholic leaders never talk about condoms now or eating fish on Friday. They stuck their spit covered finger in the air to see where the wind was blowing, and figured out the future value of church donations would be higher if the congregation allowed LGBTQ members with zero criticism. The formerly considered abominations against God?? Thrown out the window, just short of instantly.
Kemp’s recent statements are about the future Black vote. Georgia Republicans have now figured out their future is very barren in Georgia without the Black vote. So now they say “Oh you thought we liked donald trump?? Au contraire mon frère!!!!!!
For the very naive earlier on in the comments section here, it has nothing to do with “taking the high ground”. It’s mainland China style pragmatic politics.
As you probably remember I have been a big Stacey Abrams supporter. But this story makes me angry:
https://www.msn.com/en-us/news/politics/trump-adviser-roger-stone-embraces-left-wing-conspiracy-theory-declares-brian-kemp-likely-stole-election-from-stacey-abrams/ar-AA1g6O3x?ocid=msedgdhp&pc=U531&cvid=31c8e7282f1446cea92fbc0e5729c2db&ei=6
Trump Adviser Roger Stone Embraces Left-Wing Conspiracy Theory, Declares Brian Kemp Likely Stole Election From Stacey Abrams
Well yea the Georgia Republicans may have cheated in 2018. But Roger Stone is only trying to excuse Trump’s behavior after he clearly lost a very fair 2020 election. Like Stone ever cared about black women running for office.
I try to give Abrams slack, because I think as you also have pointed out, she did a lot of terrific things related to getting Blacks more active and engaged on using their votes. It’s very much to her credit. But on other issues the woman pushes my tolerance. She really does.
The strongest evidence in support of GOP stealing elections is that they ALWAYS project. Whenever they accuse someone of something you know they either already did, or are planning to do, the same thing themselves. However, that is not enough to bring it to court.
It’s always hot in July, therefor, the name “July” creates heat in Earth’s atmosphere. And when we take the effects of all other variables away, the name “July” still creates heat in Earth’s atmosphere. The Philips curve is garbage, the same as the quantity theory of money. And it makes me sad that otherwise intelligent people can’t see that.
Jobs do not create inflation, not matter what someone who plays with regressions etc tells you.
Menzie is apparently running an error correction model in choosing his blog topics.
As long as he doesn’t point out MY errors, I’m cool with the whole thing. Oh, man……. Friday night. Even on en error, I’m slmost the the point I would be honored to be named in a Menzie post, even an error (footnote: not really). But I did get Menzie to change the wording on one of his posts for me. He may have been just humoring me, but you know what?? It’s probably the best I’ll ever get here, and I’ll take it/
I should add I don’t mind, and enjoy, Menzie’s correction of me in the comments/threads. But in the blog post part, I don’t know, that seems it would be sensitive muscle tissue for me, er something.
https://www.msn.com/en-us/money/markets/really-bad-economics-nobel-laureate-joseph-stiglitz-explains-where-the-fed-went-wrong-on-inflation/ar-AA1g5C6K?ocid=msedgdhp&pc=U531&cvid=8a57634abfb243829733b614c0dc5bbc&ei=14
Stiglitz on the temporary rise inflation. Those that blamed excess demand were not doing their homework.
Something tells me that Kevin Drum has been reading the BS from JohnH on real wages:
https://jabberwocking.com/weekly-earnings-rose-4-3-in-august/
‘After adjusting for inflation, average weekly earnings increased at an annualized rate of 4.3% in August:
Hourly earnings barely budged, but average hours worked increased 3.6%. This accounted for nearly the entire increase.’
Kevin does graph average weekly earnings for extended period of time which had a huge upward job followed by a gradual decline. Of course during that period where we saw the gradual decline average hours worked fell. So during this period that both ignores the initial jump AND ignores hours worked, little Jonny boy can spin ‘real wages’ were falling even as real wages per hour rose.
Maybe it takes two excellent bloggers (Kevin Drum and our host) to keep up with the parade of lies ala JohnH!
You can count on it. After real wages decline or stagnate for years, they suddenly rise a bit…and, surely as the earthworm rises from the soggy ground, pgl will rise up and proclaim that I had been lying all along for pointing out that real wages had been declining or stagnating all those years.
Well, I am glad that the rate of inflation has declined to the point where real wages have finally to rise a bit, though it is sure to be temporary and most of the gains will go to the top 10%, though economists prefer to avoid mention of that part of the story…
“After real wages decline or stagnate for years, they suddenly rise a bit”
Precisely what happened to UK real wages under Cameron. But of course Jonny boy kept telling us that real wages were higher as a result of Cameron’s fiscal austerity.
Dude – you lied for years about this. Keep it coming troll.
Yeah, inflation hit UK workers hard for years. But then in 2015 inflation dropped to the point where economists like Krugman started hectoring us about how bad deflation was going to be for workers. But contrary to his expert opinion, real wages rose, unemployment was at a record low, and labor participation was at a record high, trends that continued for some time afterwards.
Of course, pgl conveniently disregards how much real wages declined under Cameron’s predecessor Gordon Brown. Furthermore, as much as pgl likes to demonize Cameron, he chooses to overlook how Obama got austerity enacted in the US. And he consistently denied and provided cover for years of Obamausterity, just as any committed partisan hack would do. Personally, I liked Sturgeon and her proposals for stimulus.
Kevin Drum is worried about this:
‘Unemployment rose by 514,000, and 525,000 people dropped out of the labor force.’
The rise in unemployment was not from a fall in employment but from a rise in people working.
Civilian noninstitutional population minus civilian labor force = not in labor force.
Population rose by 211 thousand while those holding or looking for jobs rose by 736 thousand. So Kevin’s second concern strikes me as weird. Maybe someone should tell Kevin to relax.
Menzie Chinn,
I’m perplexed as to why you purposefully neglect to report out-of-sample metrics. Despite the results, what bizarro world of forecasting accuracy do you work in when reporting only regression results?????????
purposefully neglect?
Seriously dude – can you be more obnoxious? Is this your sole purpose in life – being a jerk? Well – at least you are good at one thing.
Econned: Eyeballing tells one that the two forecasts are pretty close in predictive ability, while Phillips overpredicts and Quantity Theory underpreidts. But for your enjoyment, I’ve added ME, RMSFE, and MAE to the post.
Menzie Chinn,
By “your enjoyment” do you actually mean “completeness and the most baseline practice“?
SHUT UP! You are beyond disgusting. There is zero point to your hate filled rants. None. Run along worthless and stupid troll. Pollute some other blog so the grownups here do not have to read your trash.
There, there, there? No need for pglto have a tantrum…just ask mommy for a bottle and everything will be fine…
So you are Econned are now BFFs? Go figure!
What? pgl’s mommy couldn’t calm his tantrum?
@ Stalker
Some people claim that there’s a woman to blame, but Stalker doesn’t….. it’s whoever’s near damn fault
Something tells me Econned has never listened to a Jimmy Buffett tune.
Professional jealousy on display once again econned.
Menzie Chinn,
Please tell us, is “eyeballing” the standard nowadays at Wisconsin? The NBER? Your ruse is far too easy to see through – it’s a shame your econbrowser fangirls/fanboys are unwilling(unable?) to remove their Menzie-shaded glasses to see through these posts.
Do you have a point? Oh yea – you are a jerk. Dude – we all know that.
Econned, All i see is a bitter old man who is exceptionally jealous of prof chinn to such a degree he tries to tear him down professionally at every opportunity. You are a sad excuse for a human being econned.
Hi Menzie,
Interesting post. Thanks for sharing! From the graph it looks like you might be able to do even better by averaging the two forecasts. Maybe theres a bit of truth in both of them?
Andrew