October NFP employment came in at 150K (below consensus 180K), private NFP at 99K (vs 158K consensus). Here’s the picture of business cycle indicators followed by the NBER’s BCDC, along with S&PGMI’s (nee Macroeconomic Advisers) monthly GDP:
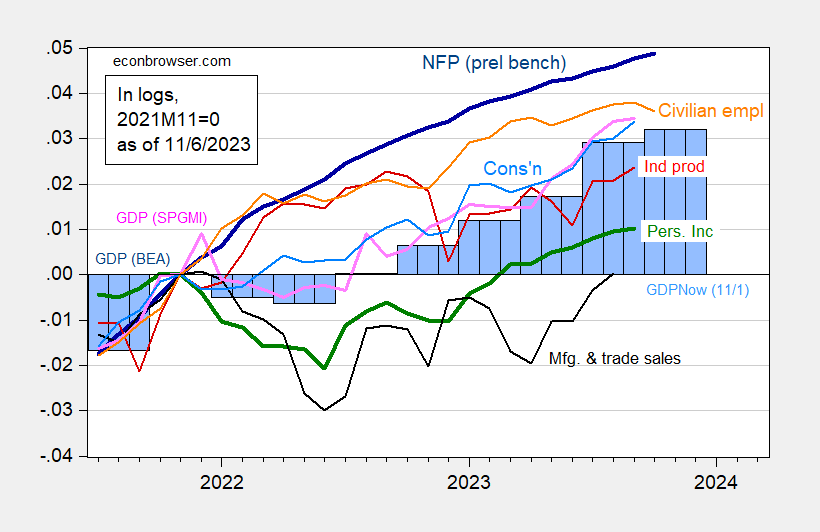
Figure 1 [updated]: Nonfarm Payroll employment incorporating preliminary benchmark (dark blue), civilian employment (orange), industrial production (red), personal income excluding transfers in Ch.2017$ (green), manufacturing and trade sales in Ch.2017$ (black), consumption in Ch.2017$ (light blue), and monthly GDP in Ch.2017$ (pink), GDP (blue bars), all log normalized to 2021M11=0. Source: BLS via FRED, BLS preliminary benchmark, Federal Reserve, BEA 2023Q2 third release incorporating comprehensive revisions, S&P Global/IHS Markit (nee Macroeconomic Advisers, IHS Markit) (11/1/2023 release), Atlanta Fed (11/1/2023 release), and author’s calculations.
There is some thought that the civilian employment (CPS) series peaks before the CES nonfarm payroll employment series does. Over the last four recessions this has been true twice (using the data available at the time) [1]. So, the decline in the civilian employment might be taken as an indicator of recession, even if it does not predict economic actvity vere well.
Note that while civilian employment as measured by the CPS fell slightly, the employment series adjusted to the NFP concept rose in October. Here are the alternative series:
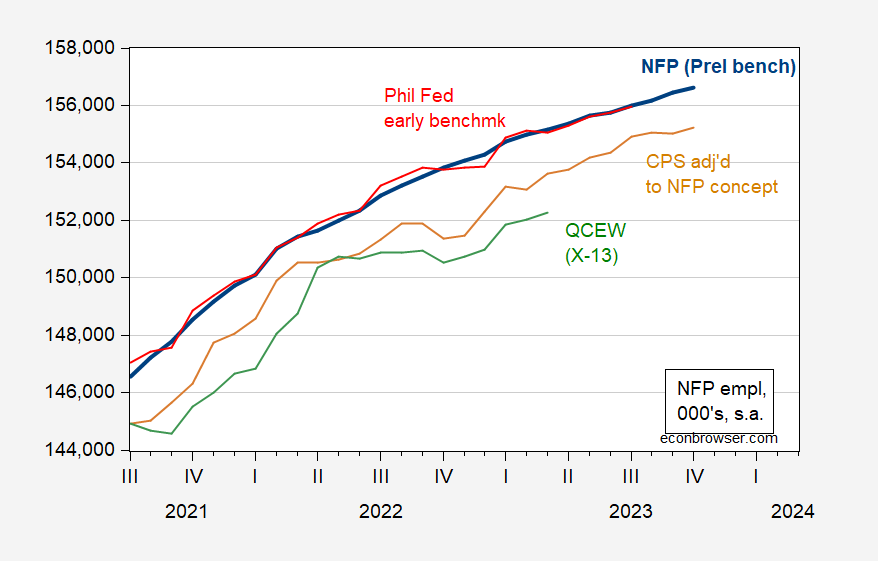
Figure 2: NFP employment incorporating preliminary benchmark calculated by author (bold blue), Philadelphia Fed early benchmark (red), household employment adjusted to conform to NFP concept (tan), and QCEW covered employment adjusted by Census X-13 by author (green), all in thousands, seasonally adjusted. Source: BLS via FRED, Philadelphia Fed, BLS, BLS-QCEW, and author’s calculations.
That being said, two indicators not followed by the NBER are suggestive. First the real-time Sahm Indicator.
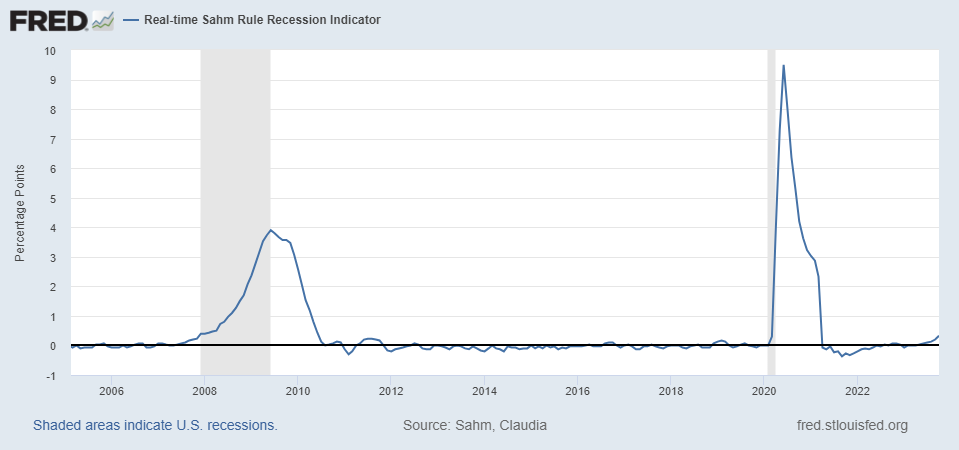
Source: FRED, accessed 11/3/2023.
The October reading is 0.33, where 0.50 is the threshold for a recession call.
Rashad Ahmed calls my attention to heavy truck sales. As I pointed out in this post, heavy truck sales are a pretty good coincident indicator of recessions (certainly more so than VMT or gasoline supplied).
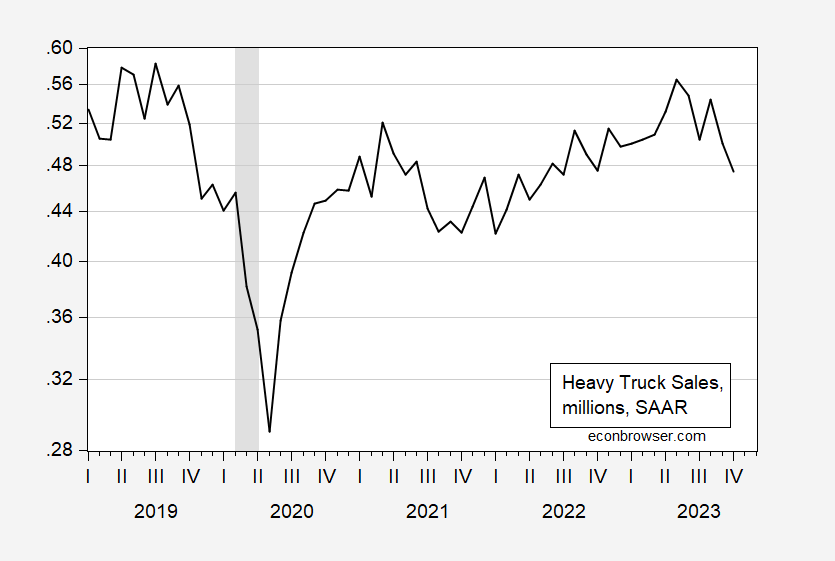
Figure 3: Heavy truck sales, in millions, SAAR (black). NBER defined peak-to-trough recession dates shaded gray. Source: Census via FRED, NBER.
Sales are down about 16% from the most recent peak in May. Year-on-year growth in sales is 0%. For now, the estimated probability for recession in October is 8%. By way of contrast, in the 2007 recession, the y/y change was about 30% when the recession started.
So, maybe no recession in October (although all variables weill be revised), but these two (coincident) indicators are moving in that direction.
I wonder if this is a war crime. It’s certainly inhumane.
Israel is forcing Palestinians into Gaza while attacking Gaza:
https://www.reuters.com/world/middle-east/thousands-gazan-workers-sent-back-israel-occupied-west-bank-witnesses-2023-11-03/
Similar thoughts from Kevin Drum:
https://jabberwocking.com/is-a-recession-getting-close/
Or is Kevin cheating by reading your posts and then writing his based on your insights?
Claudia Sahm has responded to today’s jobs report, and to questions about the implication of the rise in the jobless rate, in an email. She notes that her recession indicator has risen to 0.33, below the 0.5 threshold that indicates recession is underway. So there is no recession signal. Here’s the current-data (real time) version of her indicator, with the U3 jobless rate superimposed:
https://fred.stlouisfed.org/graph/?g=1aX8k
Sahm points out that her indicator is not a forecast, but an (coincident) indicator (like truck sales). She goes on to note that a rising unemployment rate is not a good sign. As I have pointed out in the past, a persistent rise in the U3 unemployment rate is a pretty good, very short-term leading indicator of recession. A persistent stall in the downward progress of the U3 rate is a pretty good leading indicator, with a longer lead. Look for yourself if you doubt. Downward progress stalled and there has been a rise in the U3 rate.
Sahm is right that recession isn’t inevitable just because the U3 rate has risen. But based on a few easily observed regularities in the data, like the fact that recession typically follows –
1) inversion of the curve followed by dis-inversion
2) rising debt-service burden and
3) a rising jobless rate,
– the risk of recession now seems more elevated than earlier this year or last year.
One fact worth repeating here is that things are different since the Covid recession. Maybe several leading recession indicators are simply out of whack this time – it wouldn’t be that big a surprise. Prudence, however, argues against taking that bet. Restrictive monetary policy, on top of what seems likely to be restrictive fiscal policy, is a bad idea when warning lights are flashing.
The reason the unemployment rate rose is that the household survey had employment falling by 348 thousand even though the payroll survey suggested decent growth. Let’s take a step back before suggesting her rule = recession.
But yea – time to lower interest rates. As far as this new Speaker, nothing he wants to do including slashing spending makes any sense.
Sometimes Kevin Drum is smart and sometimes he is just dumb. And in this case he is just dumb.
The Sahm Rule is precisely worded: “The Sahm Recession Indicator signals the start of a recession when the three-month moving average of the national unemployment rate (U3) rises by 0.50 percentage points or more relative to its low during the previous 12 months.”
Note “three-month moving average”, both for the low and for the high. When Drum says “This month marks a half point increase from the April low of 3.4%” he’s just being dumb, as dumb as those folk who say two quarters of negative GDP is a recession.
The low in this cycle was a three-month average of 3.5% back in April. So for the Sahm Indicator we would need a three-month average of 4% before April. We haven’t even had one month of 4% unemployment in the last two years. That doesn’t mean it can’t happen but it also means it isn’t imminent either.
One more thing about the jobless rate as a leading indicator. In recent cycles, the jobless rate for men has turned up slightly earlier than for women:
https://fred.stlouisfed.org/graph/?g=1aXeA
Take a look at what just happened to the jobless rate for men.
OK, two more things. We don’t have much history on hires, but what we have suggests hires slow before recession. Looking at net job growth gives comfort when comfort may not be warrented. Look what is happening to hires in this cycle while net jobgrowth remains strong:
https://fred.stlouisfed.org/graph/?g=1aXo4
Calculated Risk suggests about 30K jobs lost directly from autoworkers on strike:
https://www.calculatedriskblog.com/2023/11/october-employment-preview.html
You probably would have to set at least another 30K lost from auto suppliers. So that is 60K from the temporary effects of auto strikes. That would get you from 30K below consensus to 30K above.
Yeah, but forecasters should be able to count strikers. The number subtracted in October will, however, be added back in November.