Industrial production under consensus (+0.2% [corrected 12/16] m/m vs +0.3% Bloomberg consensus). Here’s the picture of some key indicators followed by the NBER Business Cycle Dating Committee, plus monthly GDP and GDPNow.
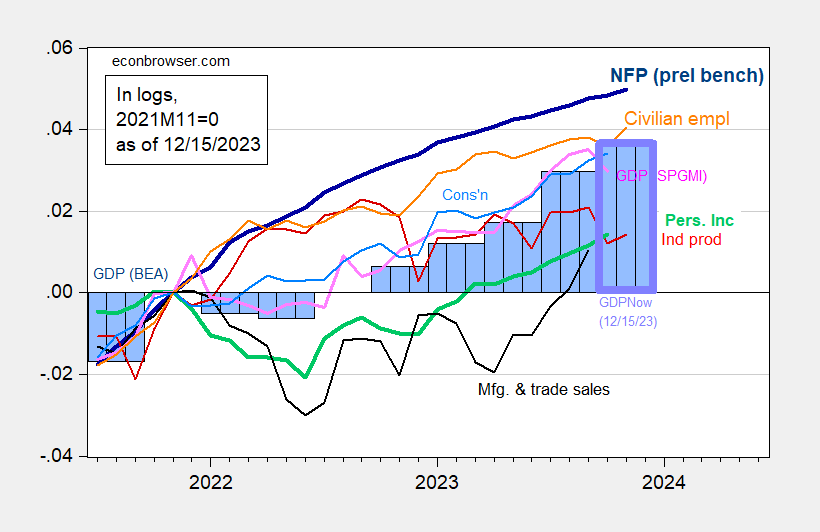
Figure 1: Nonfarm Payroll employment incorporating preliminary benchmark (bold dark blue), implied level using Bloomberg consensus as of 12/4 (blue +), civilian employment (orange), industrial production (red), personal income excluding transfers in Ch.2017$ (bold green), manufacturing and trade sales in Ch.2017$ (black), consumption in Ch.2017$ (light blue), and monthly GDP in Ch.2017$ (pink), GDP, 2nd release (blue bars), and GDPNow for 2023Q4 as of 12/15 (lilac box), all log normalized to 2021M11=0. Source: BLS via FRED, BLS preliminary benchmark, Federal Reserve, BEA 2023Q3 2nd release incorporating comprehensive revisions, S&P Global/IHS Markit (nee Macroeconomic Advisers, IHS Markit) (12/1/2023 release), Atlanta Fed, and author’s calculations.
Note that as of today, GDPNow is at 2.6% for Q4 (q/q SAAR), up from 1.2% on 12/7. NY Fed nowcast is at 2.21% for Q4 (and 1.98% for 2024Q1).
Guyana and Venezuela may have dodged a bullet:
https://venezuelanalysis.com/news/venezuela-and-guyana-to-maintain-direct-dialogue-amid-essequibo-dispute/
They’ve agreed to seek a non-violent solution to Venezuela’s land-grabbing intentions.
Maduro needs distractions from domestic problems, but doesn’t need more trouble. Saber-rattling and regular demand for other people’s stuff may be the best he can do.
Amazing what a little US-Guyana naval exercise can do. Thank you President Biden for being an experienced and competent politician.
drive by comment; that looks like a minus sign in your opening line, Menzie (-0.2% m/m); it looked unsigned (plus) when i read the report earlier…
ok, it was all returning autoworkers, and IP for the four prior months was revised down by more, but they did manage to put up an increase..
rjs: Yes, you’re right. will fix.
I saw elsewhere that there is an inverted yield curve, but only one place that isn’t exactly reliable. But, I’ll admit that I haven’t been paying much attention recently. Anybody know any more about that? I figure this is the place to ask.