From CBO’s Current View of the Economy From 2023 to 2025:
Compared with its February 2023 projections, CBO’s current projections exhibit weaker growth, lower unemployment, and higher interest rates in 2024 and 2025.2 The agency’s current projections of inflation are mixed relative to those made in February 2023.
Table 1 summarizes:
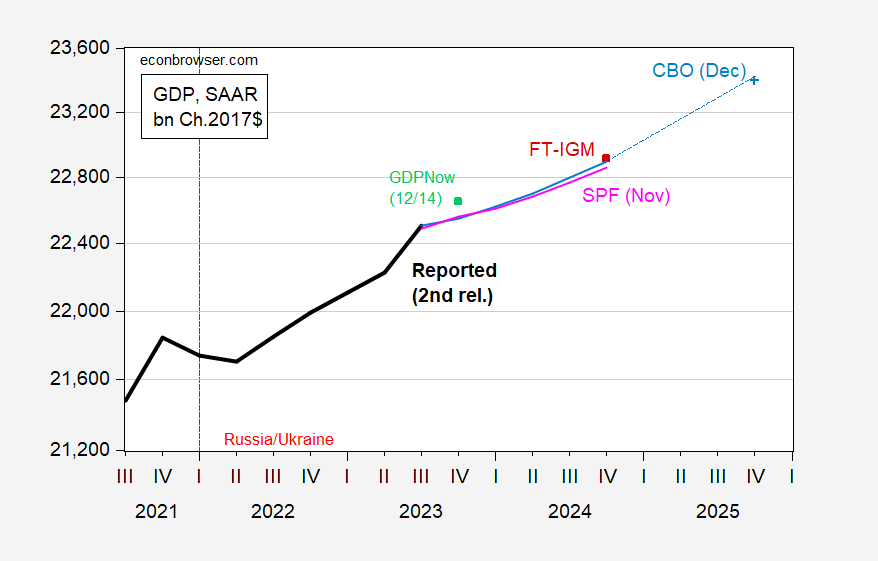
CBO’s path for GDP looks slightly better than the Survey of Professional Forecasters median, matches 2024Q4 FT-IGM forecast. Some differences arise from the information sets — SPF was based on beginning November data, CBO’s on data up to December 5th. The December 14 Atlanta Fed GDPNow implied level of GDP is substantially above the CBO path (GDPNow is 2.6% q/q SAAR vs. CBO 0.8%).
Figure 1: GDP (bold black), CBO December projection (sky blue), Survey of Professional Forecasters November median forecast (pink), FT-IGM December median (red square), GDPNow of 14 December (green square), all in bn.Ch.2017$ SAAR. Source: BEA 2023Q3 2nd release, CBO (December 2023), Philadelphia Fed, Atlanta Fed, and author’s calculations.
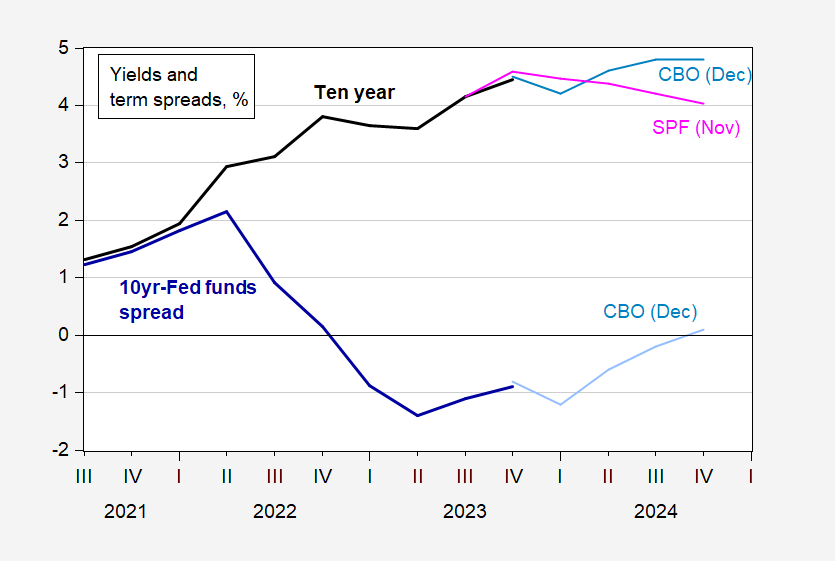
Figure 2: Ten year Treasury yield (bold black), CBO projection (sky blue), Survey of Professional Forecasters median (pink), in %; 10 yr – Fed funds spread (bold blue), CBO projection (light blue), in %. 2023Q4 observations are for data through Dec. 15. Source: Treasury, Federal Reserve Board via FRED, CBO (December 2023), and author’s calculations.
There’s an interesting divergence between SPF survey forecasts and CBO projections, where CBO projects a temporary decline and then increase. SPF (admittedly from November as opposed to December) sees a steady decline. Two points highlighted by CBO explain why the interest rate path is higher than in February:
- Higher interest rates in 2024 and 2025 reflect stronger economic activity in 2023, which resulted in the Federal Reserve raising the target range for the federal funds rate higher than what CBO projected in February 2023.
- The upward revision to inflation in the consumer price index for all urban consumers (CPI-U) in 2025 (by 0.3 percentage points) reflects faster-than-expected growth in the cost of housing services. (The CPI-U places more weight on the cost of housing services than the PCE price index does.) PCE inflation in 2024 that is lower than previously projected (by 0.3 percentage points) stems from better-than-expected improvements in supply conditions affecting prices that receive more weight in the PCE price index than in the CPI-U.
One thing to remember is that CBO is required to make projections based on current law. SPF and FT-IGM respondents are not, and can condition on anything.
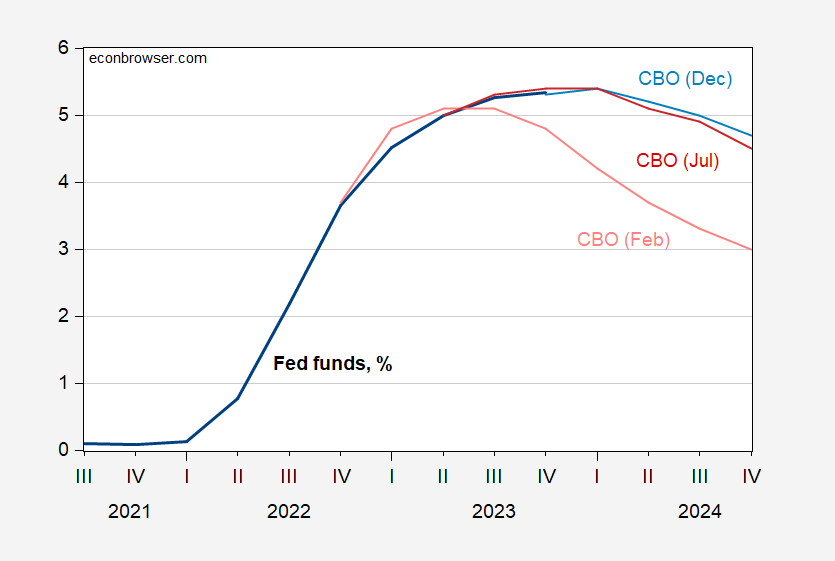
The higher, longer interest rates is demonstrated — relative to February, but not so much to July.
Figure 3: Fed funds (bold black), CBO projection (sky blue), CBO July projection (red), CBO Feb projection (salmon), in %. 2023Q4 observations are for data through Dec. 15. Source: Treasury, Federal Reserve Board via FRED, CBO (December 2023), and author’s calculations.
Note that the projected Fed funds rate is for a projected December 2024 12 month PCE inflation rate of 2.1% (2.4% core).


In honor of the recent rally in Treasuries, a brief tour of the fixed income market –
A disaggregation of the ten-year Treasury yield:
https://fred.stlouisfed.org/graph/?g=1cTtS
Essentially all of the recent decline in yields is due to a drop in the expected cost of funds, just as essentially all of the increase since July was due to a rise in the expected cost of funds. Inflation expectations have been relatively steady, and the ten-year term premium remains near zero.
The yield curve is still inverted at ten years:
https://fred.stlouisfed.org/graph/?g=1cTuJ
Markets are pricing in rate cuts over the next 2 years, but not over the next 3 months:
https://fred.stlouisfed.org/graph/?g=1cTwW
The risk spread for mortgages is still quite wide relative to that for corporate debt:
https://fred.stlouisfed.org/graph/?g=1cTvF
This suggests lenders view mortgages as quite risky, relative to corporates.
Funding stress (short-term availability of dollar funding) is moderate, and has declined and smoothed out this year since March:
https://en.macromicro.me/charts/45928/us-fra-ois-spread
Unsubstantiated claim by Tricky Ducky: “all of the recent decline in yields is due to a drop in the expected cost of funds.” Where’s the link to the data?
I’m jealous. You used to be my mentally retarded stalker. But now you are pestering someone else with your stupid questions?
Right…in…front…of…you. Substantiated. You just don’t know enough to understand what you’re looking at.
This is pure Johnny – utterly ignorant, utterly certain.
Jonny boy does this a lot. When I smacked Jotta (aka Jonny’s Mary Rosh) for claiming Russia’s FDI was way up, Jonny boy suggested I lied. Really Jonny – see figure 6 in that Treasury report Dr. Chinn linked to. Russia FDI has turned negative.
But little Jonny boy never learned to read – so hey!
“The risk spread for mortgages is still quite wide relative to that for corporate debt:”
I appreciate your reporting of the corporate debt spread (never mind that STUPID comment ala JohnH) but one question – why compare the nominal rate on long-term mortgages to the REAL rate on long-term government bonds?
I just love it when economists apply the term “real” to their highly speculative forecasts. The market sets Treasury rates and the market sets TIPS rates, both of which are based on speculation…but then economists have the audacity to call one of the rates “real,” when it is actually just the result of another beauty contest, as the lousy performance of recent inflation forecasts based on TIPS have made abundantly clear.
But then again, a lot of what economists deem real (like workers DEMANDING pay raises and driving inflation) is nothing more than assumptions which they have imagined to be plausible enough to anoint as “real” and sanctify in their catechism.
Dude – that was the dumbest comment I have ever seen. I guess you have no effing clue what I said. Oh wait – you have no effing clue how to tie your own shoe laces.
Did I? Market rate, yes. Don’t think I used an inflation-adjusted rate.
End of the legend reads “inflation indexed”. Just saying. But yea – when we have to read that mania from Jonny boy, things can get confused.
Just checked with FRED:
Nominal interest on 10-year government bonds = 3.9%.
The TIPS measure (real interest rate) = 1.7%.
You are welcome to do the arithmetic but please DO NOT Johnh to get involved. First of all this moron’s latest comment shows he has no clue what we are discussing. Secondly he still gets 2 plus 2 wrong.
What’s pgly’s point? A month and a half ago “real” rates were 2.44%. Economists’ reality sure is fickle! Who knew that reality could change on a dime? Oh, dear! It wasn’t reality that changed…it was speculators’ opinions that changed…the beauty contest in action.
Oh, and the “real” price of oil changed just a rapidly. But there is evidence that it was all driven by speculation, not a change in intrinsic value.
https://www.ineteconomics.org/perspectives/blog/oil-prices-oil-profits-speculation-and-inflation
Reminds me of Karl Rove, “We’re an empire now, and when we act, we create our own reality. And while you’re studying that reality — judiciously, as you will — we’ll act again, creating other new realities, which you can study too, and that’s how things will sort out. We’re history’s actors . . . and you, all of you, will be left to just study what we do.”
JohnH
December 19, 2023 at 3:40 pm
What’s pgly’s point?
Lord – you dumb. Getting data right has never been your forte I guess.
Let’s draw this in crayons so even a two year old gets it (which is still over the pea brain of John). Macroduck – who says a lot of smart things – made a small mistake (after all he has to correct the incessant trash from little Jonny boy).
Nominal rates on long-term mortgages are near 6.95%
Real rate on ten year Treasuries are near 1.75%
So the difference between the two series is near 5.2%
But that includes both the normally measured spread (nominal – nominal) which was 3% and not 5.2%
But wait the nominal rate on ten year Treasuries are 3.95%. Yep – expected inflation is near 2.2%.
Now Jonny boy goes off over all sorts of mess that has nothing to do with a simple point than even a two year old would get. Now give this moron a little credit – he realizes that expected inflation is not zero. But that is the only thing this clown has gotten correct in years. Which is why the adults in the room want this worthless clown to just go away.
Fixed it:
https://fred.stlouisfed.org/graph/?g=1cYYM
For those interested in the distribution of wealth, and power, UBS would like you to know that “For the first time in nine editions of the (Billionaire Ambitions) report, billionaires have accumulated more wealth through inheritance than entrepreneurship,…”
https://www.ubs.com/global/en/media/display-page-ndp/en-20231130-the-great-wealth-transfer.html?utm_source=substack&utm_medium=email
In fact, the title of this report is “UBS Billionaire Ambitions Report 2023: The great wealth transfer”.
The implication for the “equity vs growth” debate is clear; expropriation of inherited wealth is now undeniably a good deal for society. Even if it’s true that entrepreneurs require extraordinary rewards in order to do what they do (contrary to evidence), there is now more wealth being inherited than created through entrepreneurship. The luck of birth can be taxed at a very high rate without doing harm to society.
This is not the conclusion UBS reached in its report, but thanks for the heads up.
Its my understanding that the billionaires have to hire a really incompetent wealth management company to end up with any inheritance taxes. So I think the True Fund Babies will be safe unless we get a very leftish government.
I am shocked, just shocked that someone here noticed wealth inequality. I am also quite pleased.
There are actually quite a number of economic benefits to taxing both wealth and high incomes. But you would never know it from reading most economics and public policy blogs…
Great post with great links.
Interesting. Two quick observations. Real GDP for the 2023 to 2025 is projected to grow by about 2% per year on average which is enough to keep us near full employment. Also nominal ECI is forecasted to grow by more than prices.
Oh wait – forecasts? JohnH claims only he knows how to forecast accurately. Never mind the fact that this troll has trouble getting historical data right.
Yet another frivolous and mendacious snark from my stalker Peppa Pgly. Like all forecasts, the CBO one is obsolete as soon as it is released, overtaken by events. Nonetheless, some will take it into consideration as indicative of how to place their bets in the Keynesian beauty contests that are the markets.
Of course, pgl chooses to believe that these forecasts represent the “real” future, just like he believes that consumer inflation expectations magically get realized! He probably still believes in the tooth fairy and Santa Claus, too!
You just made my point – Jonny boy is the most clueless troll God ever created. Everyone of your comments here show you have no clue what the discussion was about. But then that’s par for the course for you.
Larry Summers admits error?
June 20, 2022 –
“We need five years of unemployment above 5% to contain inflation — in other words, we need two years of 7.5% unemployment or five years of 6% unemployment or one year of 10% unemployment,” said Summers said in a speech in London Monday. “There are numbers that are remarkably discouraging relative to the Fed Reserve view.”
https://www.bloomberg.com/news/articles/2022-06-20/summers-says-us-needs-5-jobless-rate-for-five-years-to-ease-cpi
December 15, 2023 –
Summers: First of all, one should always have been aware that a substantial part of the increase in inflation was transitory. So no one should have thought that most of the route from 7 per cent to 2 per cent needed to be achieved in ways that were correlated with increases in unemployment. I think there’s a question as to how much disinflation has been achieved in terms of core-type measures of inflation already. I think it is fair to say that it looks like there’s more susceptibility to the inflation expectation term. And I think it is true that the Phillips curve coefficient is looking small.
https://www.ft.com/content/59fff67e-b136-4435-89e1-2400b90f4b83
The rest of the FT article drips with Summers-style hubris; the Fed’s communication strategy is wrong, inflation expectations would have become entrenched if the Fed hadn’t jacked up rates, and so on. Still asserting his own judgement, just like “a trillion dollar package is bad politics, so we’ll just come back for a second fiscal package” and “we need a recession to beat inflation”.
He even praises Rubin’s “strong dollar” stuff, despite what happened to U.S. factory employment.
If you listen carefully, very very carefully, you can hear the silence from his colleagues in Madison, WI and in San Diego Cal. Listen very carefully, Veeeeeeeeehry carefully…….. Even the crickets on UW-Madison campus are afraid to make noise during Summers’ bipolar policy gyrations. “Larry Summers said what just yesterday?? Sorry, running late and gotta a faculty Christmas party to attend.”
https://www.msn.com/en-us/money/realestate/mortgage-rates-could-fall-below-5-next-year-emboldening-us-consumers-and-allowing-banks-to-re-liquify-fundstrat-s-tom-lee-says/ar-AA1lRbhw?ocid=msedgdhp&pc=U531&cvid=fb4b1180e711440f92080a982f5c49f0&ei=22
Mortgage rates could fall more than 200 basis points next year as the Federal Reserve slashes borrowing costs, boosting US consumers and banks, according to Fundstrat’s head of research Tom Lee. In an interview with CNBC on Wednesday, Lee predicted mortgage rates could fall to around 4.75%-5.2% next year. The 30-year fixed rate is currently around 6.95%, according to Freddie Mac data, down from a high of around 8% in October.
Is this dude serious? CBO thinks long-term government bond rates will be 4.8%. Now I doubt any serious person who tell us that the mortgage spread will become zero. So Mr. Lee – what’s your forecast for the government bond rates?