Today, we are pleased to present a guest contribution written by Kevin Pallara, Luca Rossi, and Fabrizio Venditti of the Bank of Italy. The views presented in this note represent those of the authors and do not necessarily reflect those of the Bank of Italy or the ESCB.
Between July and October long-term yields in the US rose by about 1 p.p, to then fall by about 70bp between October and November. Most of the variation in yields has been attributed by popular models developed at the FED to the term premium, that is the compensation required by investors to hold longer term securities and the associated interest rate risk. A heated debate followed, regarding the implications for financial conditions, the real economy and, ultimately, monetary policy. This column analyses the rise in the term premium within a coherent narrative across US bond, equity, and foreign exchange markets. The bulk of the increase since July can be attributed to the risk of higher-for-longer policy rates as well as lingering inflation risks. Since November, the cooling of the labour market and of inflation dynamics, together with dovish Fed’s communication, led the fall in the term premium.
- Between July and October 2023, 10y Government bond yields in the US rose by 1 p.p. (to about 5 percent) against relatively stable yields at shorter tenors. Market commentators related the steepening of the yield curve to lower recession risks, risks of higher-for-longer policy rates and news about larger–than–expected primary deficits. This increase in yields was coupled with a fall in stock prices and an appreciation of the US dollar. Between October and November, long–term yields turned around, receding by about 70 bp. A string of macroeconomic data pointing to a cooling of the labour market and slowing inflation, together with dovish comments by Fed’s officials, were the main drivers of lower yields.[1] Stock prices gained most of the loss recorded in the previous two months and the USD weakened.
- According to popular decompositions of 10y yields into expected rates and the term premium, the latter accounts for most of the variations in yields over this period (Figure 1, left hand side panel). After rising by about 1pp, the term premium fell in fact by 30bp after in November. The observed volatility of the term premium has sparked a debate on its determinants as well as on its implications for financial conditions, the real economy and, ultimately, monetary policy. For instance, commenting on the rise in the term premium since July, Dallas FED President Lorie Logan made this argument: “Financial conditions have tightened notably in recent months. But the reasons for the tightening matter. If long-term interest rates remain elevated because of higher term premiums, there may be less need to raise the fed funds rate”.[2] More generally, changes in the term premium, are typically seen as exogenous shocks to financial conditions that affect the economy much like monetary policy does. And indeed, market commentators often underscore these market movements by saying that “the markets are doing the Fed’s job”.
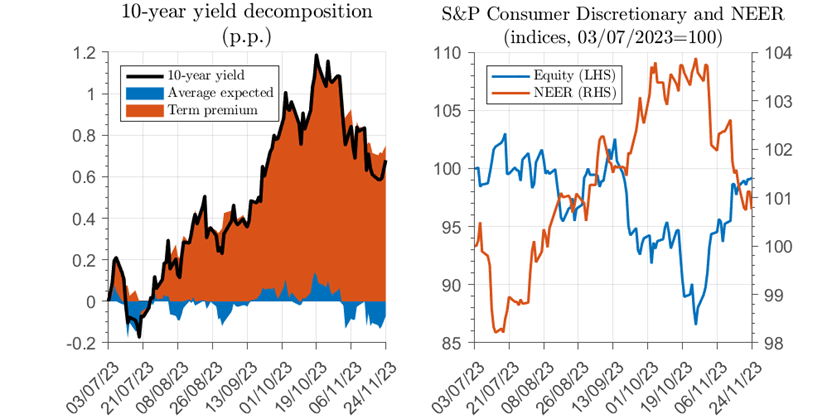
Figure 1. Bond yields, stock prices and exchange rates. Note: the left panel shows cumulated daily variations since July 3rd, 2023 until November 24th, 2023. Equity data on the right hand side refers to S&P Consumer Discretionary. Source: San Francisco FED, Refinitiv.
A MODEL-BASED NARRATIVE OF TERM PREMIUM FLUCTUATIONS
- A coherent narrative linking the rise in the term premium with broader developments in US financial markets can be gleaned from a daily econometric model decomposing asset prices into structural shocks. This decomposition is obtained from a Bayesian Vector Autoregression (BVAR) that includes the term premium, S&P Consumer Discretionary, the Nominal Effective Exchange Rate (NEER), and 10-year inflation compensation (ILS) as endogenous variables. The model is estimated using daily data between the beginning of December 2008 and the end of November 2023 and includes four lags.
- The model decomposes asset prices into four structural shocks: a domestic demand shock, a monetary policy shock, an inflation risk premium shock and a risk appetite shock.
- A domestic demand shock raises the term premium through upside risks to growth and therefore real rates.
- In the case of monetary policy, the prevailing view is that conventional monetary policy affects long-term interest rates predominantly via expected rates rather than the term premium. This view has been challenged by the empirical evidence (Gertler and Karadi, 2015a,b; Hanson and Stein, 2015; Gilchrist, López-Salido and Zakrajšek, 2015; Kaminska, Mumtaz, and Šustek, 2021) as well as by theoretical models with financial frictions. An important channel of transmission is, for instance, mortgage refinancing (Hanson, 2014). In the US, where most mortgages are supplied at fixed rates, when rates fall there is an incentive for households to pre-pay the old mortgage and to re-finance at a lower rate. Because lenders expect to be repaid sooner, the effective duration of outstanding securities connected to the mortgage market (e.g. Mortgage Backed Securities, MBS) drops. Investors that have a preference for longer duration increase the demand for long-dated government bonds, causing a reduction of the term-premium. The opposite happens when interest rates rise.
- An inflation risk premium shock captures pressure on the term premium coming from higher inflation risk (and therefore higher nominal rates risk) stemming from supply shocks and concerns about debt sustainability. [3]
- Finally, a risk appetite shock reflects changes in the appetite for safe assets due to financial or geopolitical uncertainty.
- Between the beginning of July and the end of October, a rise in inflation risk and tighter monetary policy explain the bulk of the surge in the term premium. Figure 2 (left hand side panel) shows that the main driving forces sustaining the rise in the term premium between July and October have been the monetary policy shock, in particular after the September 20th FMOC meeting, and the inflation risk shock, which translated fears of overheating into higher yields. These shocks jointly account for more than three quarters of the term premium surge. In the case of equity prices (mid panel), the combined negative effect of monetary policy and inflation risk shocks was only partly mitigated by positive domestic demand shocks. This result can be interpreted via a simple discount model in which stock prices equal the discounted sum of future earnings. Better demand prospects raised the discounted flow of earnings, pushing equity prices higher. But this effect was more than offset by higher discount rates (yields), bolstered both by a tighter policy stance and higher inflation risk. As for inflation compensation (bottom panel), the model decomposition reveals that its stability over these months reflected the tug-of-war between lingering inflation risks and the effort of the FED to keep inflation in check. Indeed, the inflation risk shock pushed inflation compensation up, but was completely offset by contractionary monetary policy shocks.
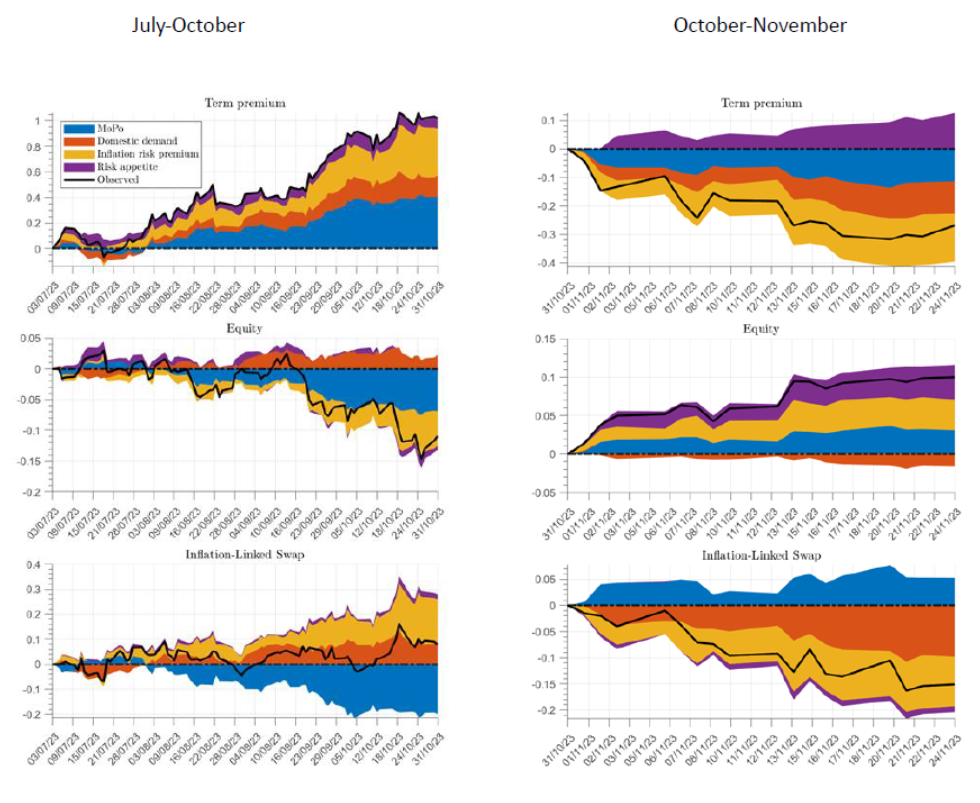
Figure 2. Historical decomposition of term premium, equity prices and inflation compensation. The left (right) subfigure shows the times series of the cumulated historical decomposition as well as the actual cumulated changes of the series since July 3rd, 2023 until October 31st, 2023 (since October 31st, 2023 until November 24th, 2023) reported on the left axis. The top panel in both subfigures reports the time series of the cumulated historical decomposition as well as the 10-year term premium. The central and bottom panels report the time series of the cumulated historical decompositions of equity prices and the 10-year Inflation-Linked Swap.
- Between October and November, financial conditions eased and the term premium fell. Latest macroeconomic releases, namely a weakened labor market, lower consumer inflation and frail retail sales, contributed to the drop in the term premium in the past month. This signaled both a more fragile domestic demand and curtailed risks of higher inflation (contribution of the domestic demand and the inflation risk premium shocks in Figure 2, right-hand subfigure). At the same time, during the November 1st FOMC meeting, Powell conceded predictions for future rate hikes were not set in stone. Powell suggested that the FED might have concluded the tightening cycle, as it refrained from increasing interest rates for the second consecutive policy meeting. This translated in the compression of term premia as uncertainty surrounding the monetary policy stance diminished (contribution of the monetary policy shock in Figure 2, right-hand subfigure). The FED’s move toward a less hawkish stance led to the most significant synchronized upward movement since November 2022, as stocks and bonds all rose together.
POLICY IMPLICATIONS
- Many observers and a number of FED officials have argued that, to the extent that changes in yields reflect changes in the term premium, they are akin to monetary policy shocks, hence obviating the need for further changes in policy.
- Our results indicate that the issue is more nuanced and that the implications for monetary policy hinge on the specific factors underlying the changes in the term premium. The model shows that, in the past four months, part of the volatility in the term premium reflected the fact that markets priced policy rates risks into long–term yields . These risks affect the economy much like monetary policy does, and therefore relieve the FED from the need to act. Yet part signaled swings in bond investors’ worries about higher long-term inflation risks stemming from a variety of factors. Should these risks turn into persistence changes in longer-term inflation expectations, they would call for FED’s policy actions.
REFERENCES
Gertler, M., & Karadi, P. (2015a). Monetary policy surprises, credit costs, and economic activity. American Economic Journal: Macroeconomics, 7(1), 44-76.
Gertler, M., & Karadi, P. (2015b). Monetary policy and credit costs. VoxEU Column, CEPR.
Gilchrist, S., López-Salido, D., & Zakrajšek, E. (2015). Monetary policy and real borrowing costs at the zero lower bound. American Economic Journal: Macroeconomics, 7(1), 77-109.
Hanson, S. G. (2014). Mortgage convexity. Journal of Financial Economics, 113(2), 270-299.
Hanson, S. G., & Stein, J. C. (2015). Monetary policy and long-term real rates. Journal of Financial Economics, 115(3), 429-448.
Kaminska, I., Mumtaz, H., & Šustek, R. (2021). Monetary policy surprises and their transmission through term premia and expected interest rates. Journal of Monetary Economics, 124, 48-65.
NOTES
[1]See, for instance, Something Appears to Be Giving, speech by FED Board of Governors member Christopher J. Waller, November 28th 2023.
[2] Financial conditions and the monetary policy outlook, speech by Dallas FED President Lorie K. Logan, October 9th 2023. Daly, President of the San Francisco FED and Waller, member of the Board of Governors, expressed similar opinions.
[3] Upwards surprises in economic activity and inflation contribute, at times, to this shock, as they may be interpreted by investors as a sign of an overheating economy carrying substantial risks of higher inflation. This leads them to require a higher compensation for holding long-dated bonds with negative effects on equity prices. It is precisely this effect on stock prices that distinguishes them from demand shocks.
This post written by Kevin Pallara, Luca Rossi, and Fabrizio Venditti.
Thanks for that. I think a few figures are missing
Paolo Zanghieri: Yes, you are right! Fixed now.
In short, expected inflation, as represented in the Inflation premium, and expected funding costs show up as point estimates in the disaggregation of interest rates. Uncertainty about inflation and funding costs show up in term premium. Uncertainty about these two factors has been elevated in recent quarters, adding to market interest rates. Domestic demand and risk appetite are not represented by a point estimate of some premium, and so are entirely represented in term premium. (This would also hold true for factors such as foreign demand and regulatory changes – entirely represented by term premium.)
I don’t think I’ve ever read a more straightforward, succinct explanation of term premium. Cut and paste into any description of interest-rate determination.
Here’s Claudia Sahm on why inflation “wasn’t transitory” (though it’s looking like it was):
“Covid was not transitory. This time last year, we were rolling from the horror of delta into Omicron, killing millions. And only months later, Putin invaded Ukraine and sent food and energy prices skyrocketing. None of the inflation hawks in March 2021 talked about Covid variants or Putin. They still don’t. They were wrong about why inflation shot up and lasted as long as it did.”
Covid and Russia kept inflation high, says a well regarded PhD economist with time at the Fed. Notably, Johnny has quoted Sahm favorably, and Sahm blames Russia’s (re)invasion of Ukraine for inflation.
So, now what? Does Johnny presume to tell us when the smart, experienced and well-trained Claudia Sahm is right and when she’s wrong?
More important that Johnny (and what isn’t?) is Sahm’s chastisement of some members of her profession who ignore Covid when talking about inflation.
Consumers are relying on a form of credit popular in the Covid era for holiday shopping:
https://www.ft.com/content/19128b12-4584-46a1-b464-39e2db19c8f3
“Buy now, pay later” is good for current consumption, bad for future consumption. While there are different varieties, a popular “pay later” scheme requires repayment over four months. That means households using this formula of finance will face extra demands for payment in Q1 of 3024. Magnitude matters, and I don’t have a useful grasp on the magnitudes involved.
Cleaning up some trash related to JohnH the serial liar who claims I am a shill for Big Oil. This discussion notes that oil profits in the UK are now taxed at 40% which is a good thing:
https://www.bbc.com/news/business-60295177
Oil profits in Australia face the same rate and have been at 40% for a long time. Oil profits in the UAE are taxed at 55%. Oil profits in Norway are taxed at 78%.
This has been true for a very long time. But little Jonny boy has not noticed as little Jonny boy is about as uninformed and stupid as it gets. m
These are the posts from Menzie, that I love so much !!! The complicated ones. I have a close relative sick from Pneumonia and “UTI” now. Can I request all our best or “worst” commenters to say prayers for my relative now?? It’s Mercy Hospital in OKC. Please prayer for us. All my friends here, PLease pray for us. God Bless you all
gladly send a prayer to those in need. wishing for the best.