Monthly GDP, as estimated by SPGMI (formerly IHS Markit/Macroeconomic Advisers) drops 0.5% m/m (-6.3% annualized!)
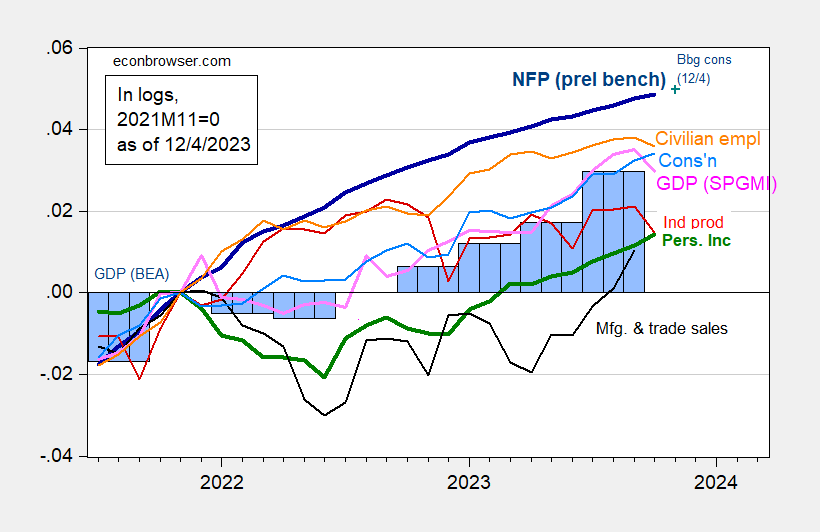
Figure 1: Nonfarm Payroll employment incorporating preliminary benchmark (bold dark blue), implied level using Bloomberg consensus as of 12/4 (blue +), civilian employment (orange), industrial production (red), personal income excluding transfers in Ch.2017$ (bold green), manufacturing and trade sales in Ch.2017$ (black), consumption in Ch.2017$ (light blue), and monthly GDP in Ch.2017$ (pink), GDP, 2nd release (blue bars), all log normalized to 2021M11=0. Source: BLS via FRED, BLS preliminary benchmark, Federal Reserve, BEA 2023Q3 2nd release incorporating comprehensive revisions, S&P Global/IHS Markit (nee Macroeconomic Advisers, IHS Markit) (12/1/2023 release), and author’s calculations.
Civilian employment, industrial production and monthly GDP declined in October, while nonfarm payroll employment and personal income ex-current transfers (both central NBER BCDC variables) continued to rise — as did consumption.
While monthly GDP declined -0.5% m/m, final sales increased 0.1% m/m. To the extent that this series more closely reflects aggregate demand, the situation looks more positive. SPGMI does, however, forecast a fairly lackluster 0.9% q/q SAAR growth for Q4.
These are backwards looking variables that are used by the NBER’s BCDC to determine business cycle turning points. Higher frequency (weekly) data through releases available by 11/25 indicate growth roughly at trend.
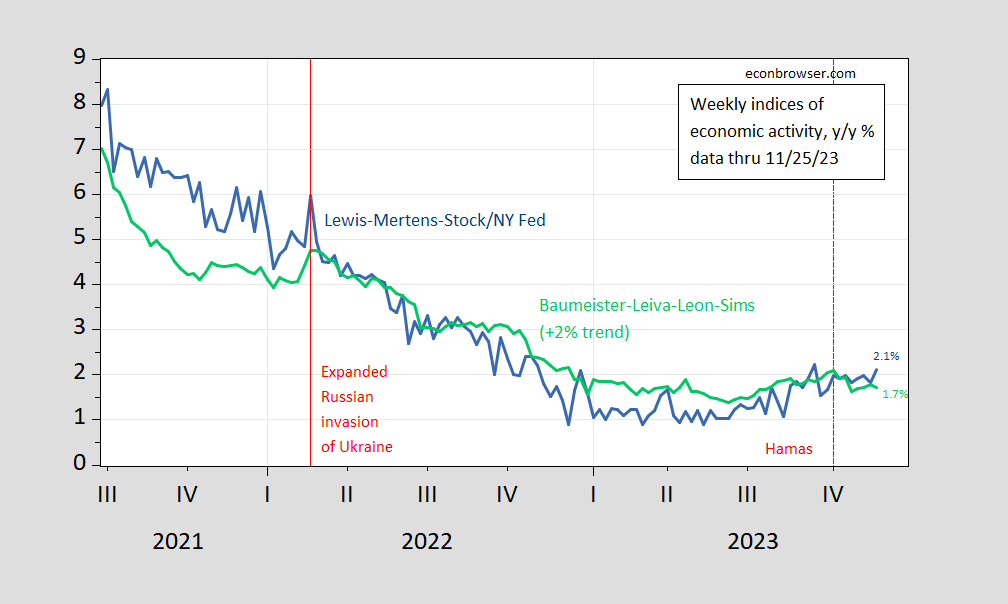
Figure 2: Lewis-Mertens-Stock Weekly Economic Index (blue), and Baumeister-Leiva-Leon-Sims Weekly Economic Conditions Index for US plus 2% trend (green), all y/y growth rate in %. Source: NY Fed via FRED, WECI, accessed 12/4, and author’s calculations.