As of mid-December, it’s hard to see the recession (even with this morning’s downward revision of GDP growth to 4.9%) so there’s a lot of triumphalism about how the oft-predicted recession of 2023. We only have monthly data through November at best, so perhaps it’s still a little premature to declare victory for 2023 — but only a little. For 2024, these concurrent indicators are of little help.
First, the series NBER Business Cycle Dating Committee focuses on, along with SPGMI monthly GDP.
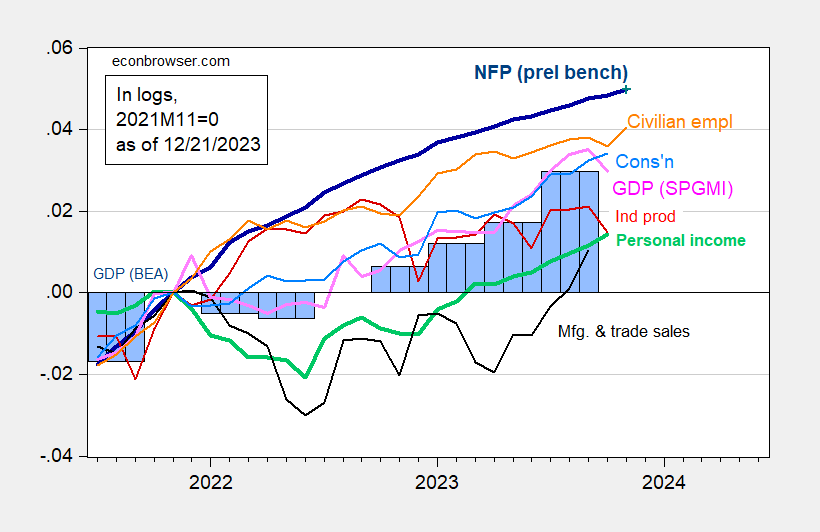
Figure 1: Nonfarm Payroll employment incorporating preliminary benchmark (bold dark blue), implied level using Bloomberg consensus as of 12/4 (blue +), civilian employment (orange), industrial production (red), personal income excluding transfers in Ch.2017$ (bold green), manufacturing and trade sales in Ch.2017$ (black), consumption in Ch.2017$ (light blue), and monthly GDP in Ch.2017$ (pink), GDP, 3rd release (blue bars), all log normalized to 2021M11=0. Source: BLS via FRED, BLS preliminary benchmark, Federal Reserve, BEA 2023Q3 2nd release incorporating comprehensive revisions, S&P Global/IHS Markit (nee Macroeconomic Advisers, IHS Markit) (12/1/2023 release), and author’s calculations.
Not shown in Figure 1 is the Atlanta Fed’s GDPNow (of 12/19), which indicates 2.7% q/q SAAR growth for 2023Q4.
Here are other popular measures: Philadelphia Fed coincident index, GDO, and Heavy Truck Sales. I’ve also added some idiosyncratic measures, like Vehicle Miles Traveled, and Gasoline Consumption.
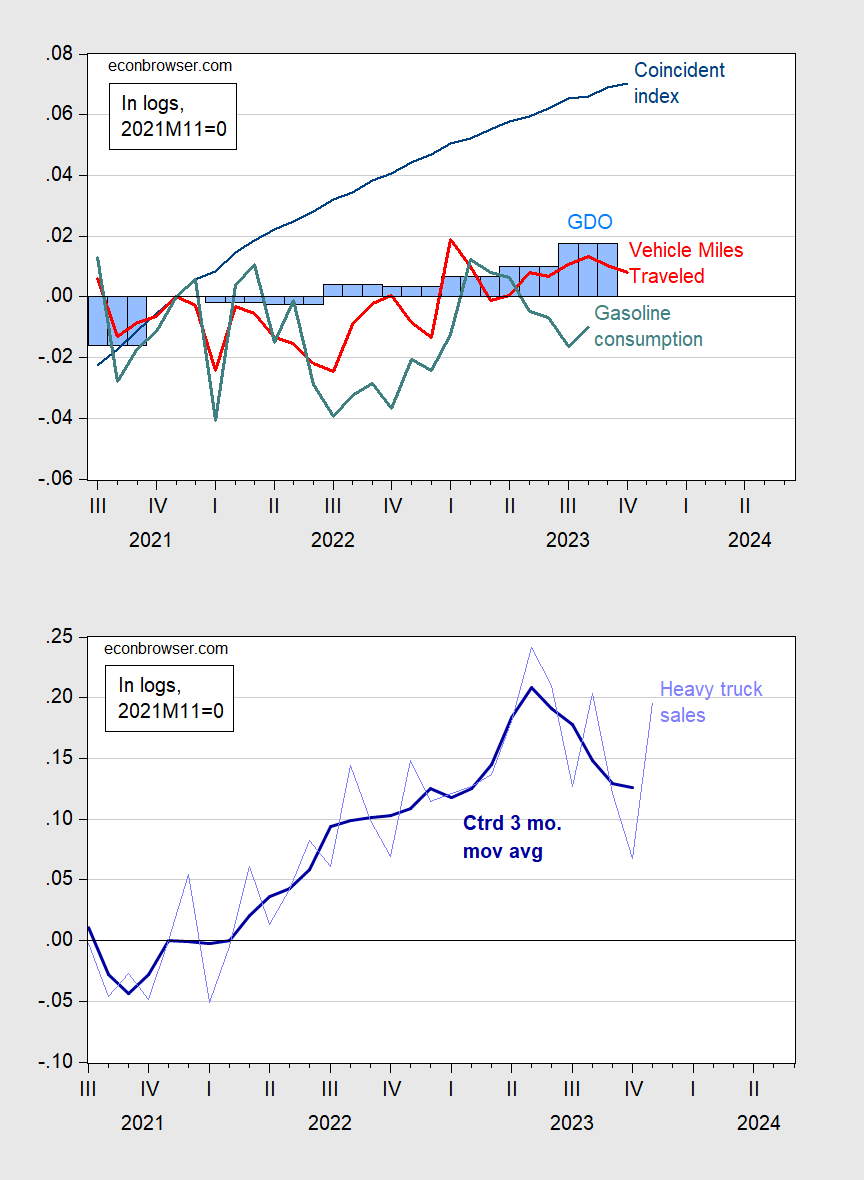
Figure 2: Top Panel Coincident Index (blue), Vehicle Miles Traveled (red), Gasoline Consumption (teal), GDO in 2017$ (blue bars), all in logs, 2021M11=0; gasoline consumption seasonally adjusted using X13 (ARIMA X11). Bottom Panel Heavy Truck Sales (light blue), centered 3 month moving average (bold dark blue), both in logs, 2021M11=0. Source: Philadelphia Fed, DoT, Census, BEA GDP 3rd release via FRED, EIA, and author’s calculations.
The coincident index is showing far faster growth than GDO, reflecting its basis in primarily labor market measures, Both travel indicators – VMT and gasoline consumption – seem particularly unreliable given work from home, and for gasoline consumption, the increasing prevalence of EV’s. Heavy Truck Sales are still up relative to 2021M11, but it’s remarkable that sales are fast declining (after a peak in April 2023), a harbinger of slowdown.
These are indicators that are lagging behind by as much as three months ago. Here are some weekly indicators of economic activity (tracking y/y GDP growth) as of a few days ago, released today.

Figure 3: Lewis-Mertens-Stock Weekly Economic Index (blue), and Baumeister-Leiva-Leon-Sims Weekly Economic Conditions Index for US plus 2% trend (green), all y/y growth rate in %. Source: NY Fed via FRED, WECI, accessed 12/21, and author’s calculations.
The WECI+2% thru 12/16 is 1.73%, while the WEI reading is 2.36%. The latter is interpretable as a y/y quarter growth of 2.36% if the 2.36% reading were to persist for an entire quarter. The Baumeister et al. reading of -0.27% is interpreted as a 0.27% growth rate below the long term trend growth rate. Average growth of US GDP over the 2000-19 period is about 2%, so this implies a 1.73% growth rate for the year ending 12/16.
Hence, we have some mixed signals for y/y growth for economic data coming in through mid-December.
Recall the WEI relies on correlations in ten series available at the weekly frequency (e.g., unemployment claims, fuel sales, retail sales), while the WECI relies on a mixed frequency dynamic factor model.
Remember how pgl and Ducky were complaining about how bad corporate profits were and how much Corporate America was suffering? Today’s BEA release shows how again just how well Corporate America is doing, despite high interest rates and trivial real pay raises.
Total corporate profits: $3.6 Trillion in 3Q23 vs. the all time record of $3.7 Trillion in 3Q22.
Profit margins: 16.2% in 3Q23 vs. the all time record of 16.7% in 3Q22. Results in 3Q23 were the fifth highest ever, much higher than the 11-12% margins of the 2010s,
Bottom line: wages stagnating barely above pre-pandemic levels; corporate profits skyrocketing since then. Peppa Pgly and Tricky Ducky, the corporate shills, fat, dumb, and happy.
What’s your source for that? I see, looking at today’s BEA release (https://www.bea.gov/news/current-releases), an annualized “Corporate profits with inventory valuation and capital consumption adjustments” of $2.305T for Q3, compared to 2018 and 2019 at $2.075T. Once a CPI-based inflation adjustment has been made, the Q3 number deflates to $1.90T, about 8.5% lower than 2018/2019.
Maybe I’m misreading the tables, as I have been known to do, but still…
Here ya go – inflation-adjusted profits (I used the GDP deflator) and profits as a share of GDP:
https://fred.stlouisfed.org/graph/?g=1d3Gy
And yes, inflation adjustment is justified, especially since Johnny compared inflation-adjusted wage gains to non-adujsted profits. Naghty, naughty, Johnny.
Here’s the thing. Real wage growth is roughly on trend, even after a recession and a bout of inflation. Johnny wants us to feel bad about that, so he uses words like “stagnate”, compares inflation-adjusted wages to nominal profits and assigns ridiculous motives to anyone who points out his dishonesty. That’s who Johnny is.
Nicely done.
‘Once a CPI-based inflation adjustment has been made’
Think about what Jonny boy wrote. Nominal profits (which this dumbass cannot properly cite) fell a bit while the price level rose. So real profits fell – in fact by more than 8% during this period.
Yea – Jonny boy is truly the dumbest person ever.
Johnny, you snivelling little liar, show where I complained about how bad profits are?
Folks, here’s what’s happening. Johnny routinely lies about economics, and pgl and I both point out his lies. Johnny, in turn, lies about pgl and me, presumably attempting to discredit us so that non-specialist readers of comments can be duped into believing Johnny.
So, Johnny, it’s a simple copy/paste-and-link operation; show the nice people where I complained that profits are low?
Snivelling little liar.
“Johnny, you snivelling little liar, show where I complained about how bad profits are?”
You haven’t. Neither have I. Now we may have said real profits are lower than they were in 2022QII. They clearly are. But Jonny boy is dumber than a retarded dog so he think a decline in nominal profits over the past 5 quarters with a rise in the price level means real profits have increased. Yea – he is THAT STUPID.
So let’s get this straight. Nominal profits fell while the price level rose but little Jonny boy concluded that real profits rose. Yea jonny is retarded
Here are year-over-year changes for three data series on real wages and compensation:
https://fred.stlouisfed.org/graph/?g=1d3oK
Note that during the period of high inflation, real wages/compensation fell, after a period of rapid rise, and are now rising again. This is what Johnny calls”stagnation”. Why does Johnny use the word “stagnation” for one of the most volatile periods on record for these series? Why does he offer no evidence for his claim when data are readily available? Well, it ain’t because he’s devoted to the truth.
As I’ve pointed out in other efforts to keep Johnny honest, all three of these series were much weaker at the same point in the past couple of expansions. Comparing the same point in various cycles is a convention in economics, because it protects against the very sort of cherry-picking of data that Johnny engages in. Johnny’s answer? He rejected this convention because it doesn’t suit his story.
This argument just keeps going ’round and ’round. Johnny chooses language that misrepresents the actual state of affairs. We correct his misrepresentation. He then misrepresents our views.
Johnny supports Russia’s invasion of Ukraine, pretends U.S. support for Ukraine against Russia is “pointless” and moans about how badly U.S. workers are doing. It’s all part of the same project – an attempt to get the U.S. to turn inward so that Russia’s aggression can continue unopposed.
Bottom line? Johnny is a Putin shill, and I’m trim, smarter than Johnny, and reasonably content.
Have we not called for JohnH to be banned before? His latest is a 3-fold POS. First this LIAR accused me and Macroduck of lamenting the woeful state of profits which neither one of us have ever done. No – we only noted that real profits have declined since 2022Q2. Here’s nominal profits:
https://fred.stlouisfed.org/series/A446RC1Q027SBEA
Yea Jonny boy spewed some numbers that he could not source and were not quite right. But note I have conceded that the sharp drop in profits have partially been reversed. But note with even Jonny boy’s questionable numbers nominal profits in 2023QIII were lower than they were in 2022QII. Which even a retarded dog would realize would mean real profits have dropped given we still have some inflation. But not Jonny boy – who is dumber than a retarded dog.
Let’s do the numbers that retarded Jonny boy cannot do. Our FRED graph shows over this period, nominal profits have declined by 4.35%. Over the same 5 quarters, the price level has increased by 4.33%. So even a retarded dog would know real profits have declined by over 8.3%. But Jonny boy this real profits have increased? Yea – Jonny boy is dumber than the dumbest retarded dog ever.