And 30 years of turnover data. Currently doing regressions on data on reserve bank holdings, in a project with Jeffrey Frankel and Hiro Ito. In terms of aggregates, we have 50 years of estimates (about 25 years of actual data, and yet fewer years on (selected) individual central bank data)
First, what we know of reserves as disclosed by IMF members:
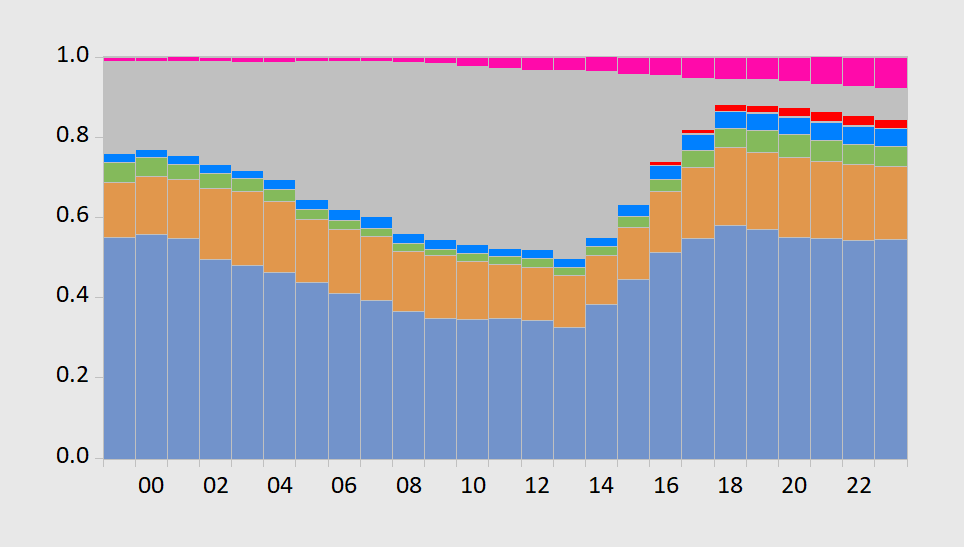
Figure 1: Estimated end-of-Year holdings of foreign exchange reserves in USD (blue bars), EUR (orange), JPY (green), GBP (blue), CNY (red), others (pink), unallocated (gray), all shares of 1.0, stacked. 2023 observation is for 2023Q3. Source: IMF COFER, accessed 1/7/2024, and author’s calculations.
Looking at Figure 1 without further investigation would impel one to think the USD had recovered its luster after years of neglect. However, if one notes the gray area is “unallocated”, or undisclosed, and further if one thinks a large portion of this was in USD, then the decline looks less marked. Whatever decline in the USD has occurred, much is accounted for by “other”, and the biggest change in “other” is from the Australian and Canadian dollars.
Through 2004 or so, the IMF provided in its annual reports estimates of reserve holdings shares. I use the reported numbers for 2000-01 to infer the proportions of unallocated reserves that are in each currency, to generate estimated shares (the proportions are 0.5 for USD, 0.07 for EUR, 0.09 for GBP, 0.07 for JPY, and 0.01 for CHF. This yields the following graph.
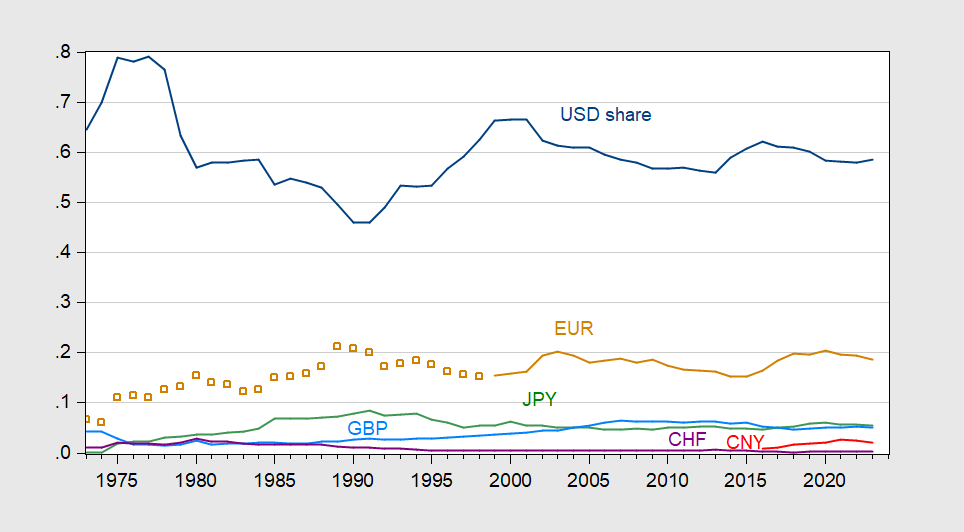
Figure 2: Share of foreign exchange reserves held by central banks, in USD (blue), EUR (orange), EUR legacy currencies (tan squares), JPY (green), GBP (sky blue), Swiss francs (purple), CNY (red). For 1999 data onward, estimates based on COFER data, and apportionment of unallocated reserves, described in text. Source: Chinn and Frankel (2007), IMF COFER accessed 1/7/2024, and author’s estimates.
Note with the estimated USD share, the US has retained its dominance, with only a slight decline in share of total forex reserves. The biggest dip is just before 2015.
A not dissimilar story is told by fx turnover.

Figure 3: Share of foreign exchange turnover in all forex instruments, in USD (blue, left scale), EUR (orange), JPY (green), GBP (sky blue), Swiss francs (purple), CNY (red). Linear interpolation between survey years. Source: BIS, and author’s calculations.
I’m not knowledgable about currencies or currency reserves. But it strikes me that a lot of it is connected to trust factor of individual governments and military power. Though you could argue Germany and Japan have little military power and still pretty good currencies. But Japan and Germany kinda have an American insurance policy there as well. So. It just seems that way to me. Nobody really trusts the Chinese authorities enough to “park” their money there. So any increases in China’s currency is going to be because of trade/sale of goods with a quick turnover on the transaction. The rest (specifically on RMB) is mainly sell side BS to generate trades/fees for broker/dealers.
many mainland chinese actively look for ways to move their money out of china and into gold, crypto or us dollars. that is why they impose capital controls on the citizens.
Germany and Japan are also big trading countries with (much of the time) big surpluses. If reserves are held to facilitate payments, then along with trust, trade (and other) payments give rise to big shares for Germany and Japan.
I recently saw a paper which attempted to estimate how much turnover is generated simply because the dollar is so liquid that going through the dollar is the cheapest route to trade other currencies. Aussie/Yen was a specific example chosen, in which going through the dollar is cheaper – big surprise to me. The paper estimated that something like mid-20% to 30-something percent of dollar trade is just to facilitate trade in other currencies.
As long as the dollar is that much cheaper to trade, it’s going to be the turn-over champ.
I’ll try to find the paper and provide a link.
Sounds like a good one.
Moses, I’m driving myself nuts trying to find that paper. (%$#@!!!) While looking for it, I stumbled across this:
https://www.gsb.stanford.edu/faculty-research/publications/mind-gap-sovereign-debt-markets-us-treasury-basis-dollar-risk-factor
Egg on my face, it was presented at Jackson hole in 2019, and I missed it. Lesson: Always read the abstract from every Jackson Hole paper, so you can sound smart on as little effort as possible.
You know how sometimes Menzie writes about covered interest parity in the foreign exchange market? The idea that arbitrage will more or less exactly equilibrate interest rates and foreign exchange rates? Except that’s alot less true since the Great Financial Crisis? Turns out, that failure of a basic rule of the financial universe has cousins in other markets.
Well of course it does!!! Did I think it through? Nooo! But once somebody explains it, it’s obvious as a fart in an elevator. And just as embarassing.
Anyhow, I know you get a kick out of FX stuff, so there it is. Enjoy.
And another thing! You know how I go on and on about liquidity risks when dollar financing indicators tighten up? Right there in the paper. Should have read it four years ago. (%$#@!!!)
P.S. I mostly ignore the math.
“Moses, I’m driving myself nuts trying to find that paper.”
Been there. I appreciate it. I will read the paper. As much reading as I have done on currencies/FX (and in totality I have done a decent amount) it’s amazing how little I know. What I do know is due to my college years (75% of that I probably already forgot) and being a fanboy of Professor Chinn’s and Gita Gopinath’s. But I’m pretty sure both of them would give me failing grades or slide me with a D if I attended their classes.
Krishnamurthy has about 4 other closely related papers you can get on the SSRN page that I bet are worth a read as well. I bet you get around to reading them before I do I have so much reading on my list and I am exceedingly lazy:
https://papers.ssrn.com/sol3/cf_dev/AbsByAuth.cfm?per_id=2518044
Happy reading
So trump says out loud what all maga hatters believe in their demented heads. He hopes the economy crashes under biden. What a sick and tormented crew trump and the maga crowd are. So selfish to wish that on the country. Unpatriotic and selfish and cruel. Pathetic human beings.
I heard Trump’s rant too. Could someone remind him that the economy did crash during the last year he was President?
There’s a boatload of typos in this, for what reason I have no idea why. But it’s still readable. I always found the idea very fascinating:
https://www.boeckler.de/pdf/v_2011_10_27_davidson.pdf
Maybe it’s debatable that the current IMF and WB already perform these functions?? I don’t know, but if they are it seems the functions aren’t solving a lot of the problem when we think of how Greece was bullied, etc.
Think I know where the typos come from. The original text was in a format not well recognized by a word processor through which it was run. Notice that letters are fine, but quotation marks, apostrophes and the like are a mess. That was common when moving a document between word processing programs in olden times – still happens today, though less often.
Which is to say, the author and his editors aren’t to blame; no need to doubt their intellectual abilities simply because of typos.
In JohnH’s latest tirade that economists support tax cuts for rich people, he cites a 2015 NPR discussion noting how Nobel Prize winning economists Donald Trump and Ted Cruz claimed tax cuts would boost economic growth. Yea – Jonny boy is a lying fool but the story tried to alert us to an interesting paper by William Gale and Andrew Samwick. The link did not work but this does:
https://www.brookings.edu/articles/effects-of-income-tax-changes-on-economic-growth/
Abstract
This paper examines how changes to the individual income tax affect long-term economic growth. The structure and financing of a tax change are critical to achieving economic growth. Tax rate cuts may encourage individuals to work, save, and invest, but if the tax cuts are not financed by immediate spending cuts, they will likely also result in an increased federal budget deficit, which in the long-term will reduce national saving and raise interest rates. The net impact on growth is uncertain, but many estimates suggest it is either small or negative. Base-broadening measures can eliminate the effect of tax rate cuts on budget deficits, but at the same time, they reduce the impact on labor supply, saving, and investment and thus reduce the direct impact on growth. They may also reallocate resources across sectors toward their highest-value economic use, resulting in increased efficiency and potentially raising the overall size of the economy. Results in the literature suggest that not all tax changes will have the same impact on growth. Reforms that improve incentives, reduce existing distortionary subsidies, avoid windfall gains, and avoid deficit financing will have more auspicious effects on the long-term size of the economy, but may also create trade-offs between equity and efficiency.
Two excellent economists who disagree with Cruz and Trump. And from Jonny boy’s own link which of course Jonny boy did not really read.
Just some interesting political numbers:
https://poll.qu.edu/poll-release?releaseid=3888
A little good news:
https://rhg.com/research/us-greenhouse-gas-emissions-2023/
In 2023, the US experienced something it hasn’t since before the COVID-19 pandemic: a growing economy paired with shrinking greenhouse gas (GHG) emissions. After two years of emissions growth, while the country rebounded from the pandemic and its associated economic disruptions, we estimate that emissions were down 1.9% year-on-year in 2023, while the economy expanded by 2.4% over the course of the year. US emissions remained below pre-pandemic levels and dropped to 17.2% below 2005 levels.
A relatively mild winter and declining generation from coal power plants drove down emissions in the power and buildings sectors. Transportation sector emissions rose by 1.6%, though fuel consumption still held below pre-pandemic levels, while increases in domestic oil and gas production led to a 1% increase in industrial emissions. It’s still too early to say whether the Inflation Reduction Act (IRA) and the Infrastructure Investment and Jobs Act (IIJA) will fully achieve their projected emissions impacts. A decline in economy-wide emissions is a step in the right direction, but that rate of decline needs to more than triple and sustain at that level every year from 2024 through 2030 in order to meet the US’s climate target under the Paris Agreement of a 50-52% reduction in emissions.
Economic growth and shrinking emissions in 2023
The US economy continued its post-pandemic growth, with GDP expanding at a projected annual rate of 2.4% in 2023, buoyed by increases in consumer and government spending. Inflation remains elevated and, though lower than in 2022, is creating headwinds across the economy, but particularly in the energy sector.
Despite a growing economy, we estimate that US GHG emissions declined in 2023. The US will get its final GHG report card for 2023 when the EPA finalizes its annual GHG inventory in spring 2025. However, using preliminary economic and energy activity data, we project that economy-wide emissions declined by 1.9% in 2023 from 2022 levels—the largest decline in emissions since 2016, not counting the pandemic-influenced drop in 2020 (Figure 1). This puts US emissions at 17.2% below 2005 levels; emissions remain around 6% down from 2019 levels, before the pandemic.
Declined. While the economy grew. That’s so utterly not the plan. The plan is for that to happen over many years.
Yes, it’s a one-off, but it demonstrates what’s possible. Excellent.
Nice find.