Personal spending comes in at consensus, personal income above. Here’s a picture of key indicators followed by the NBER Business Cycle Dating Committee plus monthly GDP.
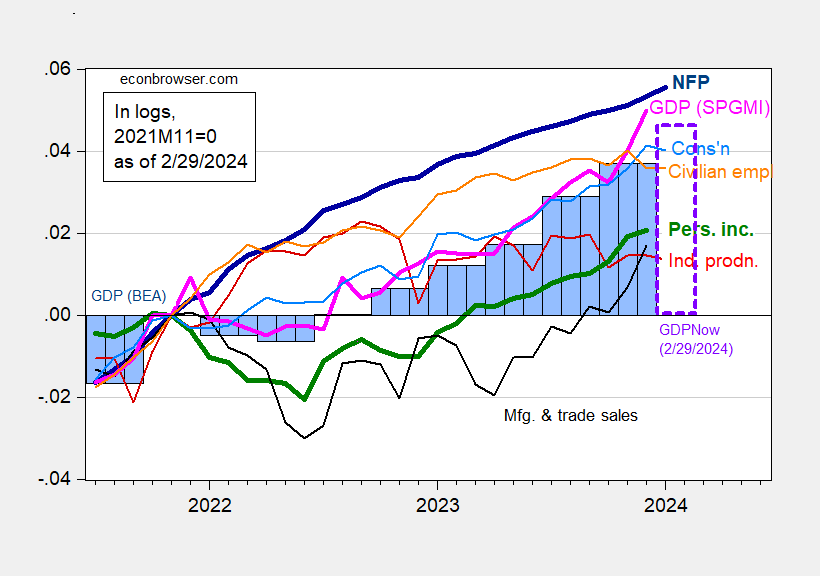
Figure 1: Nonfarm Payroll employment (bold dark blue), civilian employment (orange), industrial production (red), personal income excluding current transfers in Ch.2017$ (bold green), manufacturing and trade sales in Ch.2017$ (black), consumption in Ch.2017$ (light blue), and monthly GDP in Ch.2017$ (pink), GDP, 2nd release (blue bars), GDPNow for 2024Q1 as of 2/29 (lilac box), all log normalized to 2021M11=0. Source: BLS via FRED, Federal Reserve, BEA 2023Q4 2nd release, Atlanta Fed, S&P Global Market Insights (nee Macroeconomic Advisers, IHS Markit) (2/1/2024 release), and author’s calculations.
GDPNow for Q1 is 3.0% (q/q AR) as of today.
Here are some alternative indicators: heavy truck sales, coincident index, and vehicle miles traveled.

Figure 2: Heavy truck sales (blue), coincident index (tan), vehicle miles traveled, s.a. using X-13 (green), all in logs, 2021M11=0. Source: Census, Philadelphia Fed, NHTSA via FRED, and author’s calculations.
While vehicle miles traveled is trending sideways, it’s not a reliable predictor or coincident indicator of recession (see this post). Heavy truck sales – including the 12 month growth rate – is a good indicator. This measure is well outside of the recession zone. The coincident index from the Philadelphia Fed indicates no slowdown.
I’m hard pressed to see an ongoing recession in the December-January data.
Not off topic, but idiosyncratic –
The business press has been reporting since a least last September that an apartment glut is shaping up in Nashville. One story from January noted 16,000 empty units with 18,000 more under construction. This week, the USAToday-affiliated Tennessean reported that rents are falling, with vacancies at a 20-year high.
Now, it’s true that the apartment shortage nationwide has eased. Reis (now Moody’s) reported in January that the nationwide vacancy rate in Q4 2023 was 5.4%, near the pandemic peak of 5.5%, and that effective rent were off 1.7% from a year ago. Not, however, the 20-year high vacancy rate in what before and during the early part of the pandemic was one of the hottest markets in the country.
This is overshoot. Housing tends to overshoot for a handful of reasons, most of which have to do with the structure of lending in real estate development. Hot markets are particularly likely to overshoot. We are probably going to see more stories like this one from other hot markets, especially where land-use restrictions are not a problem. Maybe some of you already know of some similar stories. Nature of the beast.
Coincidentally, the local NPR affiliate ran a story today about homelessness in Nashville. The data from the annual January homelessness survey haven’t been released, but survey participants say their numbers were up his January over last and were up last January, too. We’re building the wrong housing units, unit for people who don’t need them, rather than units for people who do.
I would sure like to see some overshoot in Seattle. My young friends are strapped by rent unless they are highly paid techies. Even some of them are rent poor. There is no apparent lack of construction. Just endless demand.
I sure don’t see anecdotal evidence of any downturn around here. Laid off techies land on their feet fairly quickly. Even downtown, which was badly hurt by the pandemic, is showing signs of returning life.
WSJ’s Justin Lahart has an interesting story on CPI vs the Core PCE Index on page 2 of Friday’s paper. He seems to indicate the Fed is more focused on the Core PCE Index.
Hi Menzie, how is James doing ?