Today we present a guest post written by Matías Scaglione and Romina Soria, co-founders of the data science and economic consulting firm Motio Research. This post offers a concise introduction to a new monthly series of U.S. household income data officially launched by Motio Research in December 2023.
Motio Research, a data science and economic consulting firm, officially launched a monthly series of household income data for the United States in December 2023. The new series is based on microdata from the Current Population Survey and follows the core methodology of a discontinued series that garnered widespread national media attention in the 2010s.
As co-founders of Motio Research, we believe that this monthly series offers a key, timely gauge of the economic well-being of American households. It stands in contrast to the published official estimates, which are reported on a calendar-year basis and suffer from a significant delay between data collection and publication.
Background
In October 2011, the consulting firm Sentier Research, led by two former U.S. Census Bureau officials, began publishing a monthly series of household income data for the United States based on Current Population Survey (CPS) microdata. The CPS is the primary source of labor force statistics for the United States and had not been utilized to produce monthly household income estimates until that time.
For the first time, this new series introduced monthly estimates of U.S. median household income, derived from the pre-tax money income that households report earning in the previous twelve months. In contrast, the official Census estimate of median household income is reported on a calendar-year basis and suffers from a significant delay between data collection and publication, with data for a given calendar year being published in September of the following year.
The novel household income estimates were widely cited by national media outlets and policymakers as an important monthly indicator of the economic well-being of households in the United States (see coverage examples here, here, and here). Sheila Bair, who served as the Chair of FDIC during the Great Recession, notably chose a chart displaying Sentier’s median household income index for The Washington Post as the most significant graph of 2013 (see article). The Sentier series led Bair to conclude in December 2013 that “for a large number of American households, there has been no economic recovery.”
The Sentier income series kept providing valuable information on the monthly trend of U.S. household incomes in the aftermath of the Great Recession and during the ensuing economic recovery, until December 2019. In early 2020, Sentier announced the cessation of its operations due to financial difficulties, resulting in the discontinuation of the series. Since then, a monthly series of U.S. household income exclusively derived from CPS microdata has not been released.
In December 2023, we launched a new series of monthly U.S. household income data, following the core methodology employed by Sentier and incorporating improvements that enhance the series’ stability and predictive performance.
Data and method
Our monthly series of household income data are derived from monthly CPS microdata published by the U.S. Census Bureau. The CPS is a nationally representative survey with a sample size of roughly 60,000 eligible households, covering the noninstitutionalized civilian population.
The official series of annual median household income is calculated using a different data set, a supplement to the CPS called the Annual Social and Economic Supplement (ASEC). This survey has a current sample size of more than 75,000 households and is designed to capture poverty and income characteristics of the population for the previous calendar year.
The income question included in the monthly CPS asks households to report their total income in the last twelve months, including “money from jobs, net income from business, farm or rent, pensions, dividends, interest, social security payments, and any other money income received” from all household members ages fifteen or older. Respondents are asked to select from sixteen income intervals.
Households included in the CPS are surveyed for eight months in total, spending four consecutive months in the survey since their entrance, being then taken out from the survey for eight consecutive months, and then being reintroduced into the survey for their final four consecutive months. Respondents can be grouped according to their month in the survey, so there are eight groups of roughly similar size of respondents each month.
A key issue for the computation of our monthly household income estimates is that “fresh” household income data is only available in the first and fifth months of the respondent’s tenure in the survey, with the remaining two sets of consecutive months (2, 3, and 4; and 6, 7, and 8) carrying forward the values reported in months 1 and 5, respectively. Fresh household income data thus represents roughly one-fourth of the monthly sample, but we have decided to adhere to Sentier’s approach of utilizing the entire sample, considering the high volatility associated with a series reliant solely on the most current data.
The first step in the computation of our household income series is the imputation of actual income values derived from the sixteen income brackets that households use to report their income over the last twelve months. For the bottom fifteen income intervals, we followed the method used by Sentier, where income values are derived by income bracket following a uniform distribution. For the top bracket, we use a Pareto interpolation, where income values are derived following a standard Pareto distribution.
The inflation adjustment must be performed at the microdata level due to the co-existence of four different months’ worth of past twelve-months income data within each monthly survey. We adjust the household income values using the seasonally-adjusted Consumer Price Index for All Urban Consumers (CPI-U). Household income values are adjusted for inflation according to the household’s month in the survey, using twelve-month averages of the CPI-U.
The resulting series are adjusted for seasonality using the X-13ARIMA-SEATS software, which is produced, distributed, and maintained by the Census.
The Motio Median Household Income Index
The initial series made available to the public is the Motio U.S. Median Household Income Index (MHII), a median household income index adjusted for inflation and seasonality. An interactive chart of the index is available at motioresearch.com/household-income-series/. The index is updated shortly after both the CPS file and the U.S. Consumer Price Index for the reference month become available, typically in the second to third week of each month subsequent to the reference month.
The MHII begins with a value of 100.0 in January 2010 and reaches a value of 112.8 in January 2024, equivalent to $77,397 (see chart below). The index initially declined, reflecting the lingering impact of the Great Recession until mid-2011. Subsequently, it experienced a prolonged bottom until mid-2012 and then consistently rose until the onset of the Covid pandemic.
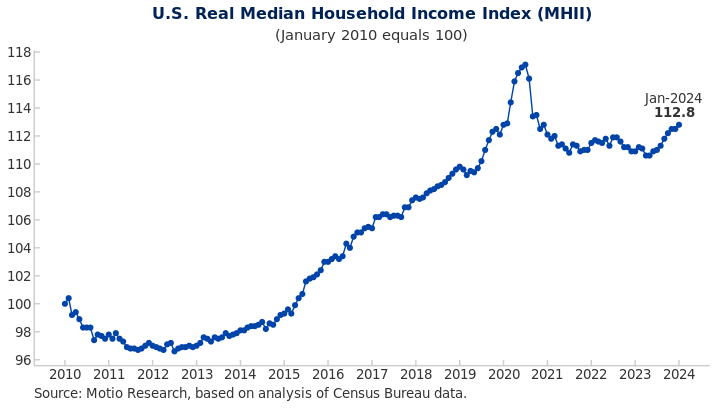
The spike and sharp decline in March-October 2020 are primarily attributed to the effect of nonresponse bias in the CPS during the initial months of the pandemic. Nonresponse bias in this case refers to the fact that lower-income households were less likely to respond to the survey (see Ward and Anne Edwards, 2021). We recommend taking the February 2020 value as the peak for 2020 for practical purposes.
Real median household income declined thereafter and plateaued below the pre-Covid maximum value since early 2021, amid historically high inflation. The index reached a post-Covid minimum value in April-May 2023 and has shown renewed strength since June 2023. With a value of 112.8 in January 2024, the index is approaching the pre-Covid peak of 112.9 observed almost four years ago, in February 2020.
In closing, and to reiterate, we believe that tracking monthly household income trends provides a unique vantage point into the evolving economic well-being of American households. Our commitment is to deliver accurate, timely, and comprehensive data and analysis to thoroughly inform this perspective.
References
Ward, Jason M., and Kathryn Anne Edwards. 2021. “CPS Nonresponse During the COVID-19 Pandemic: Explanations, Extent, and Effects.” Labour Economics 72: 102060. doi:10.1016/j.labeco.2021.102060. URL https://www.sciencedirect.com/science/article/pii/S0927537121000956
This post written by Matías Scaglione and Romina Soria.
Thanks very much for this. Real median household income is a uniquely valuable metric, precisely because it focuses on the welfare of the household unit as a whole.
Having this information available monthly, rather than only annually and with a nine month delay, is extremely helpful.
Wage increases vs inflation is “always” a topic of discussion, but especially a hot topic recently. So I mirror NDD’s thoughts that if the frequency of the data can be increased, it can answer many yet to be resolved questions and really contributes a lot to the tools for correct policy paths/decisions.
Off topic – interest rates.
A member of our troll choir has been getting nearly everything about interest rates wrong – that rates don’t matter for investment, that, the appropriate uses of rates adjusted for realized inflation vs expected inflation and so on. Among his recent favorite errors is to insist that households, which are net debtors to the tune of over $3 trillion, are somehow net beneficiaries from higher interest rates. Not only are households net debtors, but the interest rates most often discussed in the financial press, and by this particular troll, are considerably higher than those paid on many types of consumer fixed income assets. Recent data from the FDIC are illuminating:
https://www.fdic.gov/resources/bankers/national-rates/index.html
The naational average rate on savings accounts today is 0.46%. Two years ago, it was 0.06%. Checking accounts pay, in average, 0.07% vs 0.03% two years ago. Money market accounts average 0.66% now vs 0.08% two years ago. The effective fed funds rate 2 years ago was 0.08%, vs 5.33% today. Almost none of that rise has been past along in many conventional household saving vehicles, but our troll insists high rates are a boon to – well, he’s vague about who those beneficiaries are when we try to nail him down – but he insists that “the public” is better off because a few of them earn more than they pay in interest.
So, for two obvious, factual reasons it is simply wrong to argue that households benefit overall from higher rates. Some well-off households do, certainly. But households overall are indebted, and don’t receive the rates on their saving that our troll pretends they receive.
So, have a look at the FDIC data, also known as “reality”. Most savings instruments don’t pay high rates. Borrowing rates, on the other hand, are high. Banks and other financial firms, rich households, foreign sovereign wealth and reserve funds are the big beneficiaries, not regular folks.
I need to amend this statement:
“A member of our troll choir has been getting nearly everything about interest rates wrong…”
He gets lots of other stuff wrong, too. Have a look at Johnny’s comment below. The household income index is up over 16% from 2012 and has risen steadily over the past 3 quarters. Johnny’s comment? “When will households get ahead?” Yeesh.
Hmmm–“We recommend taking the February 2020 value as the peak for 2020 for practical purposes.
Real median household income declined thereafter and plateaued below the pre-Covid maximum value since early 2021, amid historically high inflation. The index reached a post-Covid minimum value in April-May 2023 and has shown renewed strength since June 2023. With a value of 112.8 in January 2024, the index is approaching the pre-Covid peak of 112.9 observed almost four years ago, in February 2020.”
I guess it was worth licking my wounds for the past few years just for pointing out how average households were not doing all that well despite the hype about the most marvelous economy from Krugman and his ilk. If average Americans can’t get ahead in this economy, when will they?
Johnny? Are you trying to parody your own mumbles? Mocking your mumble this time is too easy.
Apparently, Johnny is unable to discern the upward trend in the index.
“If average Americans can’t get ahead in this economy, when will they?” The answer, perfectly obvious in the upward trend, the steady progress made from 2012 through 2019 and into 2020 and the resumption of progress over the past 3 quarters, is “Most of the time. Americans get ahead most of the time, as measured by the monthly household income data presented here. Thanks for asking.”
Trying to use this data series, with its clear upward trend, to argue that U.S. households aren’t making gains is evidence of how biased Johnny is, how eager he is to deny the truth when it suits his agenda.
Believe the data before our eyes, our Johnny’s absurd claim about the data. Easy choice.
Yeah, Tricky Ducky tries to convince you not to believe your lying eyes when you read the chart…or even the quote provided by the authors.
Yes, if you move the goalposts back to 2010, you can get an upward trend…but if you look at the period in question—Feb 2020 to Jan 2024–you get stagnation.
In terms of politics, “it’s the economy, stupid!” and “are you better off than four years ago?” And the answer so far is “No,” But Democrats and their echo chamber of partisan hacks here do their best to obscure those simple facts. And then, rather than proposing a strategy to make average Americans better off, they just grouse about why voters are too stupid to see the magnificence of the economy! Echoes of Hillary’s incoherent economic message in 2016, anyone?
Ducky’s cute little dance around what has been happening for the past four years is why I call him Tricky Dcuky.
The period in question? Says who. Johnny, of course – ha has once again carefully chosen his endpoints to come up with another “U.S. BAD!” That isn’t supported by the data over the course of business cycles, over the life of the data series that has been presented here of over the past 3 quarters. Only if we pick a starting point that is lifted substantially by government transfers in oder to ward off massive suffering and prolonged recession can it be argued that households “can’t get ahead, so that’s exactly what Johnny did.
Something else that little Jonny boy missed:
“report their total income in the last twelve months, including “money from jobs, net income from business, farm or rent, pensions, dividends, interest, social security payments, and any other money income received” from all household members ages fifteen or older.”
The spike was from all that government funding to address the COVID issue. Of course that funding was temporary as any good countercyclical fiscal policy should be. And how did our new fiscal policy expert miss that? Oh wait – he is not an expert at all. He is a clown. As I noted – he somehow did not listen to the last 3 minutues of Sahm’s presentation.
Let’s also note that supports Putin’s invasion of Ukraine, while Democrats, including President Biden, oppose Russia’s invasion. So who does Johnny accuse of not proposing policies to make average Americans better off? Democrats. Democrats are the party which led the way to creating that giant government-sponsored rise in median household incomes that Johnny insists on using. Democrats are the party which has been raising minimum wages around the country. They are the party which tried to make income support for children, which drove childhood poverty to its lowest level in history earlier in the Covid pandemic, permanent. Johnny us simply lying – again – about the Party which opposes Putin’s war. Which party actually opposes policies which would improve the lives of the less well-off? The Republican Party, which has decided that Russia can jolly well have as much of Ukraine as it wants. Johnny never says a thing against the Party that doesn’t care about Ukraine.
Goal posts again? Dude – putting them on the 30 yard line is not the standard.
Jonny boys misreprentation of what this data shows is a true work of art. A massive temporary upward spike and Jonny boy thinks that must be the new norm? The mind boggles
Hmm. Take the data from The PEAK and compare to real wages under Cameron and they are quite similar. But did little Jonny boy ever concede that UK real wage on net fell? NOOOthis two face twit said they were getting better in 2015. Jonny boy is a sick joke
https://pubs.aeaweb.org/doi/pdf/10.1257/jep.14.3.37
The Significance of Federal Taxes as Automatic Stabilizers, Alan J. Auerbach and Daniel Feenberg, Journal of Economic Perspectives—Volume 14, Number 3—Summer 2000
Speaking of not being expert at automatic stabilizers – I figured little Jonny boy would not really read this paper so let us help the boy out with a few key pieces:
‘Since the period following World War II when automatic stabilizers were first discussed seriously, the U.S. tax system has experienced significant changes. The maximum marginal tax rate has declined substantially since the early 1960s. Over the same period, the payroll tax has grown steadily as a share of federal revenue, this growth offsetting relative declines in corporate and excise tax collections.’
Wait – Jonny boy tried to tell that no one in the past addressed this matter. It seems economists have been doing so for over 75 years.
‘But the effectiveness of an automatic stabilizer depends not only on how much of an increase in disposable income it produces, but also how large a private response in consumption this increase in disposable income generates. This response, in turn, will depend on how the increase in disposable income is distributed, for households with different income levels will differ in the extent to which they spend increases in current disposable income.’
Oh gee – economic theory which I guess went right over Jonny boy’s little head.
“The third series in the figure is a reprise of the first, with varying income distribution, but now the EITC and payroll tax are added.”
Jonny boy told us no one considered EITC. Heck this paper did all of this by income distribution as well.
‘We estimate that about oneseventh of the initial shock to household income would be offset by changes in household consumption. Given that the 1995 ratio of adjusted gross income to GDP was roughly 57 percent, this suggests that about 8 percent of an initial shock to GDP would be offset by changes in private consumption. We should add, though, that even this figure may overestimate the response, as it classifies as liquidity constrained many high-income households.’
Reducing the impact of a downside shock by 8% is better than nothing but it is far less than completely offsetting the shock entirely.