GDP, employment, manufacturing, debt, unemployment, etc.
Figure 1: GDP in bn.2017$ under Biden relative to first quarter of administration (blue), GDPNow for 3/7 (sky blue square), under Trump (orange). Source: BEA, Atlanta Fed, and author’s calculations.
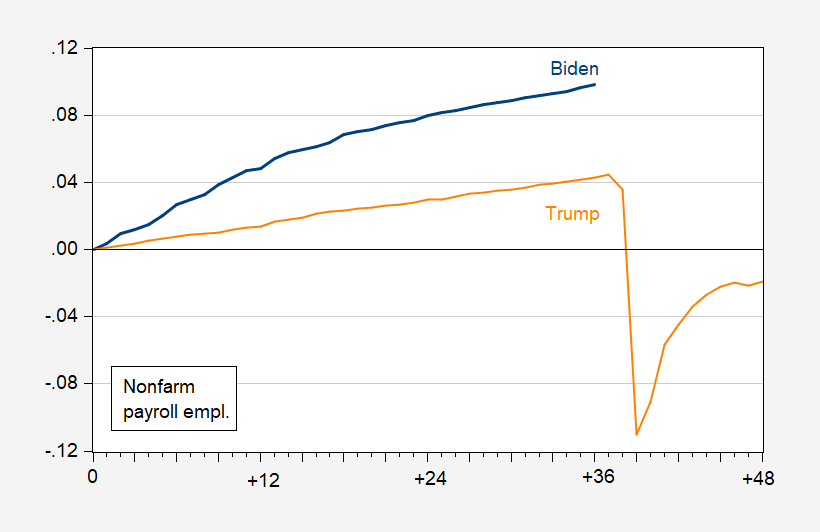
Figure 2: Nonfarm payroll employment under Biden relative to first quarter of administration (blue), under Trump (orange). Source: BLS, and author’s calculations.
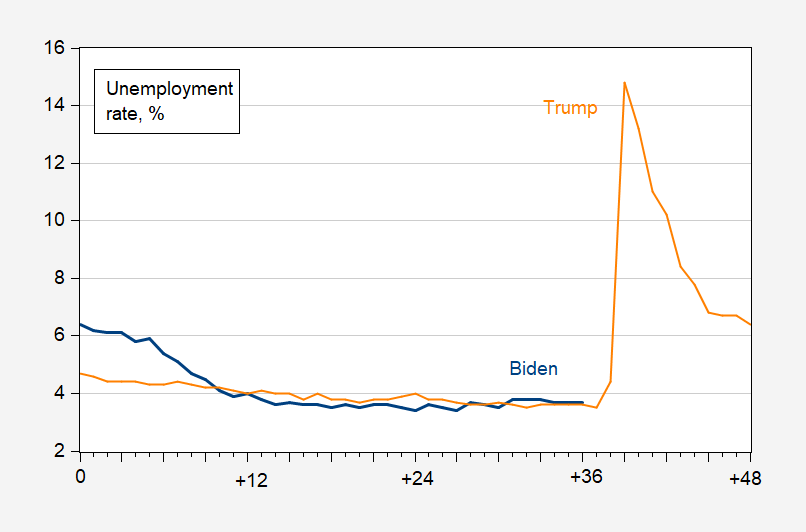
Figure 3: Unemployment rate under Biden (blue), under Trump (orange). Source: BLS.
Figure 4: Manufacturing employment under Biden relative to first quarter of administration (blue), under Trump (orange). Source: BLS, and author’s calculations.
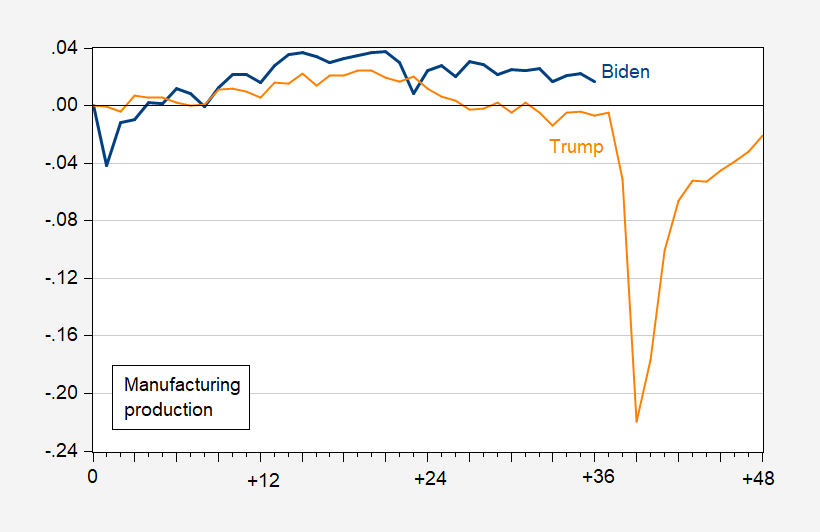
Figure 5: Manufacturing production under Biden relative to first quarter of administration (blue), under Trump (orange). Source: BLS, and author’s calculations.
Figure 6: Change in Federal debt to GDP ratio under Biden relative to first quarter of administration (blue), under Trump (orange). Source: BLS, and author’s calculations.


Menzie Chinn,
For me, these data point out a few things:
1) the sheer impact the pandemic had on the economy
2) the resiliency of the economy
3) the silliness of comparing administrations and especially so when indexing to administration start dates when data impacted by something as unprecedented as the pandemic
4) all things considered, the FOMC did a pretty good job to “promote effectively the goals of maximum employment”
5) everyone should reread Binder & Watson (2016)
“…the silliness of comparing administrations and especially so when indexing to administration start dates when data impacted by something as unprecedented as the pandemic.”
Feel free to say that to those who mirepresent the data for political purposes. Until that misrepresentation ends, there is good reason to present the actual facts.
Figure 6 is notable because we can find a contrast which isn’t (directly) Covid related. Trump’s tenure as president added to the debt faster than Biden’s before Covid hit. Biden has the extra burdens of the Covid debt and higher interest rates and is still adding debt at a slower pace than Trump.
Let’s not forget that Biden is also burdened with Trump’s era tax cuts. Personal tax cuts expire in December, 2025. Biden’s plan is to allow tax cuts to expire for those earning more than $400,000 per year, while legislating extension of the rest. That seems a little high to me, but good luck anyhow, given the behavior of the House.
We’ve had this discussion before about starting points.
Yea – your starting point is whatever Kelly Anne tells you it is.
It might be interesting to look at historical recessions (as opposed to the 2020 temporary business shutdowns) to see the patterns of employment recovery for the two years following those recessions. The 2008 recession was followed by anemic growth as a result of the banking system chaos. The 2021-22 recovery was much faster as mostly small businesses and especially the travel, restaurant, and accommodations sector were damaged by the temporary (and unnecessary) shutdowns so larger corporations/manufacturing were still in a position to ramp up production and re-hire people. Once travel resumed, that sector rebounded quickly.
https://www.pewresearch.org/social-trends/2011/07/06/v-a-brief-history-of-employment-trends-in-recessions-and-recoveries/
“The 2021-22 recovery was much faster as mostly small businesses and especially the travel, restaurant, and accommodations sector were damaged by the temporary (and unnecessary) shutdowns…”
It is a matter of opinion whether shutdowns were necessary. The record of the Spanish flu suggested that shutdowns were the correct approach. We may someday have objective assessments of the effects of the Covid shutdowns, but your opinion is a mere pretense of knowledge.
As to your claim that large firms did not lay off many workers, we know that isn’t true. ADP reported that large firms laid off 9 million workers in April of 2020, out of a total of 20 million private job cuts. In May of 2020, large firms accounted for 1.6 million of the 2.8 million job cuts.
I shouldn’t be surprised that people like Bruce make claims that are at odds with the facts, but really, don’t you tire of embarrassing yourself this way? It’s easy to know what the facts are – just go look.
Macro, I didn’t claim that large corporation didn’t lay off many workers. I did say that large corporations didn’t fail the way small businesses did because they had the means to weather the unnecessary shutdowns.
I shouldn’t be surprised that people like Macro falsely attribute propositions that I did not make.
I’m not certain I’d be getting into too many personal integrity pissing contests if I was you Bruce.
https://econbrowser.com/archives/2023/09/ode-on-a-bruce-hall-link
Bruce, uuuuh, when you tell people to hunt down a weblink the author herself has taken down due to personal shame, you’re doing it wrong.
Figure 6 is very interesting.
Borrowing under the Biden administration has actually been quite heavy, with debt held by the public increasing as follows:
2021: $1.5 trn, 6.9% of prior year’s GDP
2022: $1.4 trn, 5.6% of GDP
2023: $2.4 trn, 9.2% of GDP
And yet, debt-to-GDP really hasn’t risen under Biden. Why not? The answer is clear: inflation has eroded the value of the US incumbent debt stock, with nominal GDP rising almost as quickly as nominal debt. Of course, this wasn’t quite true in 2023, with debt held by the public increasing by 3% of GDP, from 93% to 96%.
On the other hand, interest payments have risen from 9.5% of GDP in 2020 to 13.6% of GDP in 2023. That is a whopping 4% of GDP in just increased interest payments. Further, as the incumbent debt is rolling off and has to be refinanced, interest payments will continue to rise, and fall with considerable delay even when inflation and interest rates return to lower levels.
As they say in economics, there’s no free lunch. Well, not for the economy as a whole over time. For Biden, up until now, things haven’t been too bad.
https://fred.stlouisfed.org/series/FYGFDPUN#0
https://fred.stlouisfed.org/series/A091RC1Q027SBEA
“And yet, debt-to-GDP really hasn’t risen under Biden. Why not? The answer is clear: inflation has eroded the value of the US incumbent debt stock, with nominal GDP rising almost as quickly as nominal debt.”
That is why any real economist uses real interest expenses not nominal interest expenses. Then again – little Stevie is totally clueless what Irving Fisher wrote back in 1907. Morons like Stevie pooh never understood the basics but they ure can pretend that they have some clue.
“interest payments have risen from 9.5% of GDP in 2020 to 13.6% of GDP in 2023.”
Even using your bogus nominal interest expense number, last I checked $1.025 trillion divided by something near $27 trillion is a far cry from 13.6%.
Come on Stevie – we get you are the worst consultant ever but flunking preK arithmetic? DAMN!
The free lunch business has also applied to Open Borders. Here’s my analysis from yesterday.
Illegal Immigration Outlook 2024
https://www.princetonpolicy.com/ppa-blog/2024/3/7/illegal-immigration-outlook-2024