From Bodenstein and Scaramucci (2024):
If one thought that climatological disasters would increase in frequency with global climate change, then one can infer larger and larger overall economic losses.
From Bodenstein and Scaramucci (2024):
If one thought that climatological disasters would increase in frequency with global climate change, then one can infer larger and larger overall economic losses.
0.16% of GDP is noise, essentially about the same as the average absolute variance from the advance to second estimate of US gdp, ie, it’s almost outside the capacity of the US reporting system to measure. I would not curtail fossil fuel consumption for 0.16% of GDP. If we project that onto household income of $75,000, then the impact (I realize this is a bit apples to oranges, but still…), that comes out to $120 / year. I would allow zero subsidies for EVs or renewables for a problem costing a household $120 / year.
https://apps.bea.gov/scb/issues/2021/01-january/0121-revisions-to-gdp-gdi.htm
Steven Kopits: That’s the direct cost (0.16% of GDP), so you ignore entirely the cumulative costs over time on GDP, which is the point of the LP procedure generating the IRFs.
You neglected the persistence of the effect, which means it isn’t noise. You also neglected the effect of compounding, which means that by the fifth year period examined in the study, the annual loss was 0.8% of GDP. After ten years, the annual loss was over 1.5% per year. That’s not noise. That’s the growth trend of GDP.
Stevie, if you want to pretend to some sort of expertise, you need to at least attempt to grasp the basic mathematical implications of the numbers you use.
Stevie thinks $45 BILLION per year for 10 years is noise.?.? Damn he is dumb
Right there in their first paragraph:
In the United States alone these damages reached $170 billion in 2022, see NOAA National Centers for Environmental Information (2023). However, these numbers only reflect the direct costs associated with the destruction of physical output and capital, and they do not include the indirect macroeconomic effects (e.g., foregone production, lower
production efficiency, unavailable/displaced work force) which can reach multiples of the direct damages as the weather-related shocks propagate through various channels to the broader economy
Did you even READ their paper before launching on your usual stupid criticisms? Come dude – read is not that hard unless one is the world’s worst consultant.
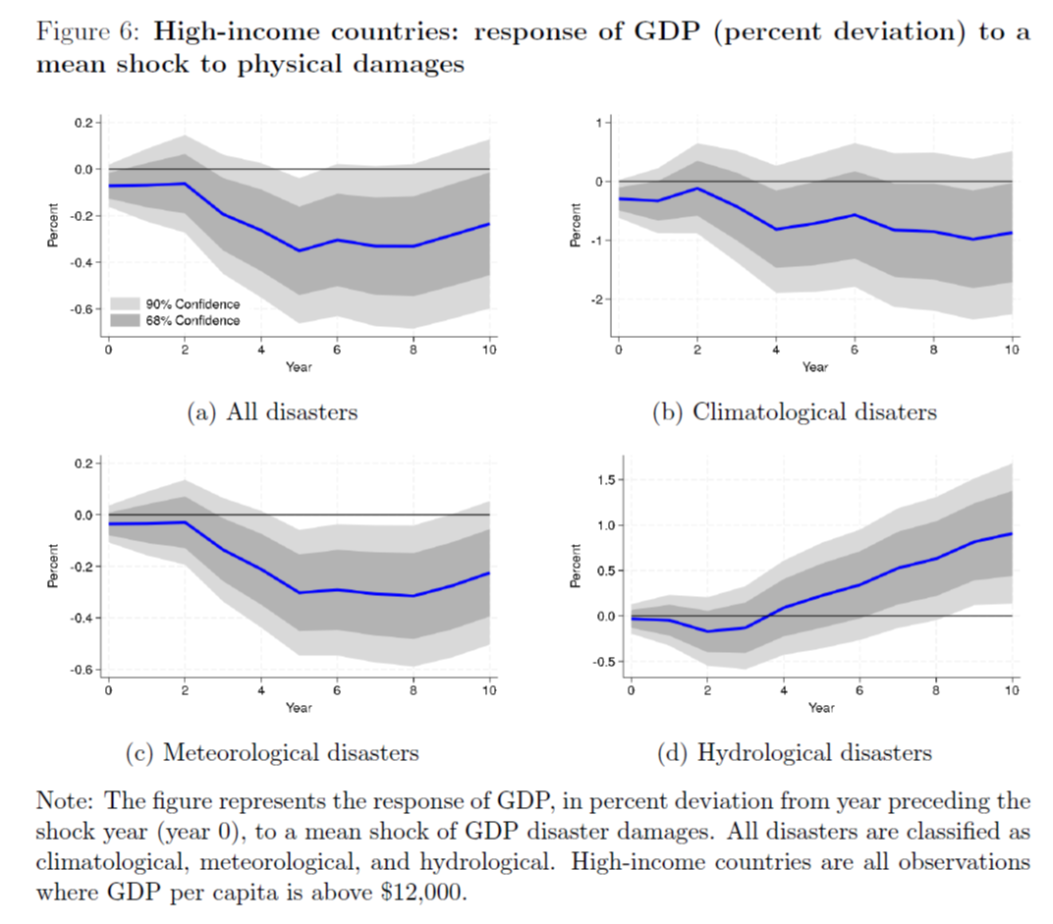
In Figure 6, loss of output persists for ten years in three of the four categories of events. The authors point to the loss of physical capital as an explanation, which is what you’d expect.
The loss of output from hydrological events persists, on average, for less than four years, and then adds to output. In Figure 3 from the paper, somewhat different results are shown – for instance, the effect of hydrological events is persistently negative. Figure 6, above, is for high-income countries, Figure 3 for all countries. The authors examine some possible explanations, such as differences in financial markets, built-in resilience, geography and country size.
Still, faster growth in the out-years is an odd response. Mobilizing overnment and insurance resources to rebuild, resulting in a multiplier effect? That would fit with the rich-country difference. Any guesses?
But if government and insurance resources are the reason that hydrological events increase growth in the out-years, why don’t meteorological events do the same? Head spinning.
According to the BBC, the EU’s climate office reports that February was the highest in record, which makes it the 7th month in a row of record high average temperatures. Highest atmospheric CO2 concentration in 2 million years. Sea surface temperatures have hit new records 7 years running.
And yes, El Nino is raising temperature averages, but we’ve had El Ninos before that didn’t produce temperatures this high.
Here’s a prediction – the denial crowd, after making sure everyone hears that El Nino is to blame for “all” of the current elevation in temperature, will turn around and say “see, temperatures aren’t a record this year, so there’s no upward trend!” once this El Nino passes.
<bMacroduck the denial crowd, after making sure everyone hears that El Nino is to blame for “all” of the current elevation in temperature, will turn around and say “see, temperatures aren’t a record this year, so there’s no upward trend!” once this El Nino passes.
Yes, we have heard that in the past, which is why I put together this little graph using “R” package HH:
https://missionaryworkamongsavages.blogspot.com/2024/02/are-couple-of-slides-showing.html
The graph compares trends for El Nino, La Nina and neutral years. The slopes are the same reflecting the effects of CO2 but the intercepts are different, reflecting the effects of each year’s class.
Love the title and the work. Thanks.
Here’s Bloomberg on the home insurance market:
https://archive.ph/XRalD
The gist: State-sponsored home insurance has doubled its market share since 2018, with coverage now over $1 trillion. That’s the result of an increase in the share of the housing stock that has fallen into high-risk insurance categories, which in turn is the result of wildfires, floods, storms and other climate-change-driven phenomena.
The increase in risk is not directly measure in GDP, but it’s a bad thing. The shift to public sector insurance doesn’t bring an improvement in risk assessment, so this is not an exercise in pricing insurance appropriately. Poor pricing of risk is bad. The benefit here is that the public sector has tax authority and at lower cost of borrowing which allows it to absorb risks that the private sector won’t absorb, or will only at a higher price than households have budgeted.
I ramble. A point estimate of the loss of output from climate events is not the whole story. There are costs which don’t show up in GDP or GDP estimates.