That’s the title of an article in Bloomberg today.
Here’s a picture of headline CPI and the “food at home” category.
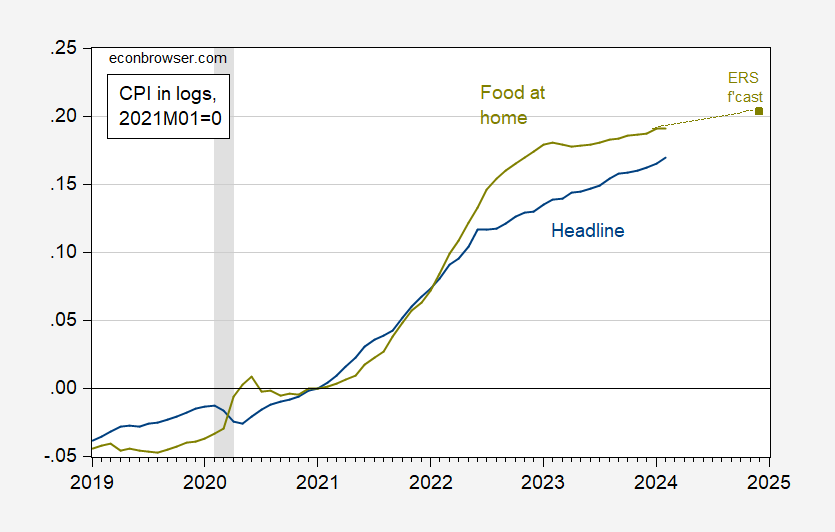
Figure 1: Headline CPI (blue), and food at home (chartreuse), and ERS forecast based on Jan CPI, all in logs 2021M01=0. NBER defined peak-to-trough recession dates shaded gray. Source: BLS via FRED, ERS, NBER, and author’s calculations.
The article is correct insofar as it uses the past tense — prices of groceries have rise. However, as Figure shows, food at home inflation has declined recently. Figure 2 depicts instantaneous inflation (per Eeckhout (2023), a=4, T-12).
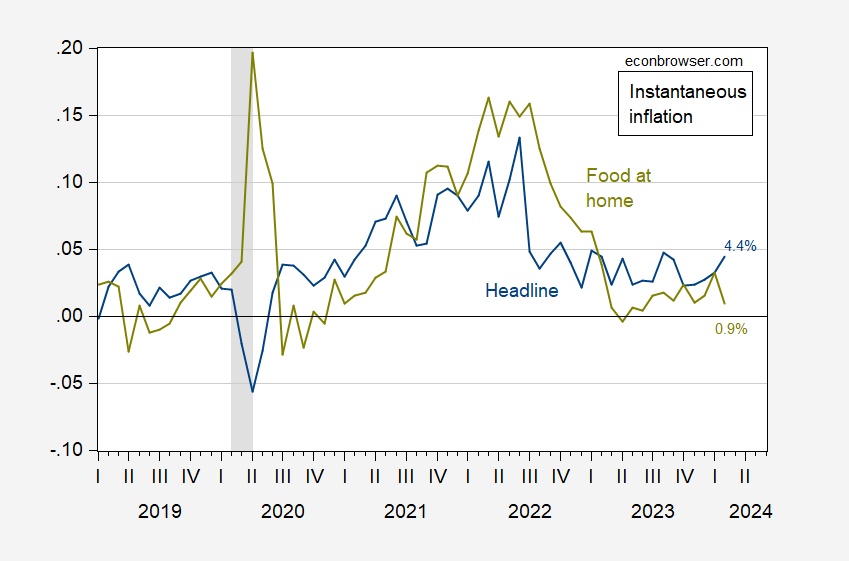
Figure 2: Headline CPI instantaneous inflation (blue), and food at home (chartreuse), per Eeckhout (2023). NBER defined peak-to-trough recession dates shaded gray. Source: BLS via FRED, NBER, and author’s calculations. [graph corrected 3/19]
In fact, month-on-month food-at-home inflation was zero in February. USDA’s ERS forecasts 1.6% 2024 y/y inflation in food at home prices, with a prediction interval of -1.8% to +5.3%.
From a sentiment standpoint, food prices are particularly salient because they — like gasoline prices — are encountered by consumers with relatively high frequency.
After reading this post I took a gander at FRED’s seasonally adjusted data for CPI-Food for Cities. What’s striking is how month-to-month variability has shrunk over the long run. From Feb 1947 thru Dec 1990 the coefficient of variance fell from 2.08 to 1.13 compared to the Jan 1991 thru Feb 2024 period. A lot less volatility in food prices. And the mean percentage change was lower as well, going from 0.33% per month to 0.22%. Especially interesting is the fact that over the last 12 months the coefficient of variation fell even further to 0.56 and the mean percent change is down to 0.18% per month. As best I can tell consumers’ memories seem to be anchored in the 2021 thru 2022 period. I guess this is what happens when you think in terms of levels rather than rates. You only know that something cost more today than it did 3 years ago even though the rate of change has stalled.
From Bloomberg:
By volume, steak sales over the last 12 months were down 20% from the same period four years earlier, according to consumer research firm NIQ.
Americans are even buying less food overall, with industry executives suggesting consumers may be eating more leftovers and digging deeper into pantries to save money. Measured by unit, grocery purchases over the past 12 months were down 2% from the prior year, though spending is up because of higher prices, according to NIQ.
I have not noticed much inflation at the store since, say, last summer. Avocados, tangelos have been unusually cheap lately; blueberries are hideously expensive, although I presume that’s due to seasonal factors.
But there has to be something going on if unit sales are down 2% over the last twelve months. I am curious whether other factors could be at play, notably those related to high interest rates like credit cards.
Wight loss drugs that reduce peoples appetite have become very popular.
I work at the world’s largest grocer, doing forecasting and inventory control, and I can tell you that unit sales aren’t meaningful except on a per-item or highly substitutable item group basis. If we don’t use them – and if they were helpful, we’d have every $$$ incentive to do so – you shouldn’t either.
From “Drovers”:
“On January 1, 2024, the All Cattle and Calves inventory was 87.15 million head, the smallest total inventory since 1951. The All Cattle and Calves inventory is 1.9 percent smaller year over year and is the fifth consecutive year of declining cattle inventories, a total decrease of 7.65 million head or 8.1 percent since the most recent peak in 2019.”
https://www.drovers.com/news/beef-production/us-cattle-inventory-reaches-73-year-low#:~:text=The%202023%20calf%20crop%20was,in%202019%20(Table%201).
Timing suggests another Covid effect, but the recent drop came after the Covid recession, and beef herd size has been trending downward since 1951.
NPR reports that pasture land for 80% of Texas cattle has burned, as have thousands of head of cattle. (It’s an odd construction – was it 80% of pasture land or us there some oddity not being explained? Dunno.) The typical pattern when feed becomes scarce is to increase slaughter, driving down beef prices, which reduces the herd so that beef prices subsequently climb. I suppose the response depends largely on just how many head died in the fire. Anyway, we may be in for some beef supply and price wobbles.
“Outsized 25% jump in food prices since just before pandemic”
Who writes these headlines for Bloomberg? A nominal price increase of 25% over FOUR years would likely be a very modest relative price increase. Come on fellows – you work for Bloomberg. Take a damn Principles of Economics class.
That’s nearly 6% annual inflation (5.7% CAGR). That’s quite a lot.
Dude do you get relative price changes. After all you pretend to be an oil consultant