Technically, the Fed targets the PCE deflator, but many use the core PCE as a proxy. I show what the data indicate, including the Cleveland Fed’s nowcast as of 3/14 for February.
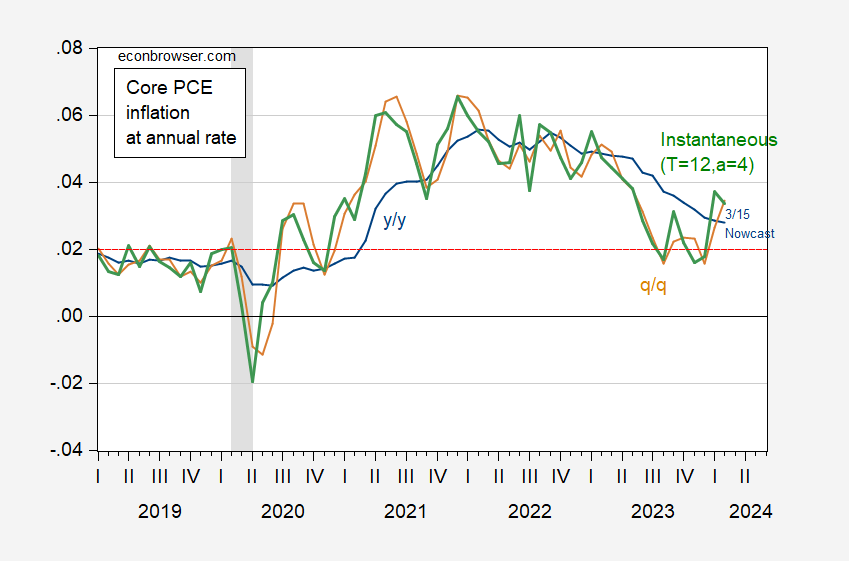
Figure 1: Core PCE deflator year-on-year inflation (blue), quarter-on-quarter (tan), and instantaneous per Eeckhout (2023) (green), at annual rates. February 2024 observation is Cleveland Fed nowcast as of 3/15. Red dashed line at 2%. Source: BEA, Cleveland Fed (3/15), NBER and author’s calculations. [mislabeled graph corrected 3/19 – MDC]
Taking the instantaneous measure, we’re a one and a half ppts 1.3 ppts above target, while the q/q measure is 1.2 1.5 ppts. [thanks to AS and Paweł Skrzypczyński for correction!]
Menzie Chinn,
Technically, this blog post is not accurately reflecting the committee’s objective function. The FOMC “seeks to achieve inflation that averages 2 percent over time”. As such, assessing an inflation target via a particular month’s PCE point estimate is outdated… and has been so for quite a few years now.
Econned: How would you present on that graph a 2% FAIT? (Skipping if you truly think they’re doing FAIT.) If I present in price levels, then when should the trend emanate from? From 2020 or maybe 2012?
Menzie Chinn,
That’s one problem, that the FOMC isn’t effectively communicating what they mean by “over time”. But their shortcomings shouldn’t excuse your ‘analysis’. They didn’t make you reference a single data point (e.g. the last sentence of your post). You’re an academic (skipping if one truly thinks you play that role online), so my suggestion would be to act the part.
Stalker, you have, by omission, misrepresented the Committee’s objective function. The Committee aims at maintaining a 2% inflation rate over time without large deviations. That includes avoiding dangerous undershooting of the 2% target.
You have clearly allowed your spite toward a better economist interfere with your thinking. Sad little man.
Professor Chinn,
On the chart it looks like the instantaneous core PCE % is for February and it looks like it could be about 3.3% to 3.4%. Using what I think are the instantaneous factors for a4, t=12. I used FRED series, PCEPILFE.
0.0002
0.0032
0.0160
0.0506
0.1235
0.2562
0.4746
0.8096
1.2969
1.9766
2.8940
4.0987
I am showing a January 2024 instantaneous inflation of 2.9%.
Perhaps a teaching moment for an enthusiast. Thanks.
AS: Could be I have the parameters wrong. Will check.
AS is right. Looks like 3-month annualized rate is displayed in the figure in orange. Core PCE instantaneous inflation rate in January 2024 was 2.9%.
Pawel Skrzypczinski: Yes, you (and AS) are right! Graph fixed now.
AS: You are right! I have fixed the graph. Thanks.
AS spotted the problem, thanks for that. Btw. thanks to this correction we can see that instantaneous inlfation measure in this setting (T=12, a=4) seems to lead the 3-month rate by 1 month. Mr. Eeckhout did truly good stuff by presenting this transformation, it is very useful not only in case of U.S. data.
Notice how AS and Pawel provide constructive commentary? As does macro. But the douchebag econned just whines like a jealous little schoolboy.
Regarding the calculation of instantaneous inflation, I notice what I think may be an easy way to derive the factors for (T=12, a=4). Prior to Professor Eeckhout’s article, I may have tried to compute a weighted average value using month numbers 1 through 12. I would have summed the values from 1 to 12 to get a weighting sum of 78, after which I would have divided each value of 1 to 12 by 78. To derive a geometric weighting, we raise each of the individual values from 1 to 12 to the 4th power, the sum is 60,710. (The number 60,710 also results from the Eeckhout article, which took me quite a while to develop a spread sheet of various values.)
Next, divide each of the numbers that were raised to the 4th power by 60,710 and multiply each by 12 and the results are the weighting factors for (T=12, a=4). For example, 12^4 = 20,736. Divide 20,736 by 60,710 and multiply by 12 =4.0987. this is the weighting for the most recent month using the instantaneous weighted average method. It then becomes easy to calculate the weighted instantaneous value using Excel. The weighting factors can be entered into a sumproduct function as constants and the twelve months data of interest are entered as change variables; for example (SUMPRODUCT(D4:D15,$A$4:$A$15))*100. In this function, the instantaneous weights are shown in column (A), rows 4 through 15, and the M/M decimal changes for the data of interest are shown in column (D), rows 4 through 15. Column (D) will change as one scrolls down the spread sheet and the weighting factors stay the same.
Although a strangely chosen title, I thought this was a pretty solid blog post:
https://numbernomics.com/the-lure-and-danger-of-deflation/
It’s interesting Slifer discusses discount stores. Just today I went to a Goodwill store and got a Charles Schultz biography over 500 pages long (not counting index and source material) for $3.10, and a old Winona Ryder film for $3.10. Uncle Moses does his best to keep down local inflation. The book also had a Boba Fett bookmark which I got for free, and I got a Hot Wheels style orange VW van for 97cents. As you may have guessed, some people never grow up.