Rising in 2023Q4:
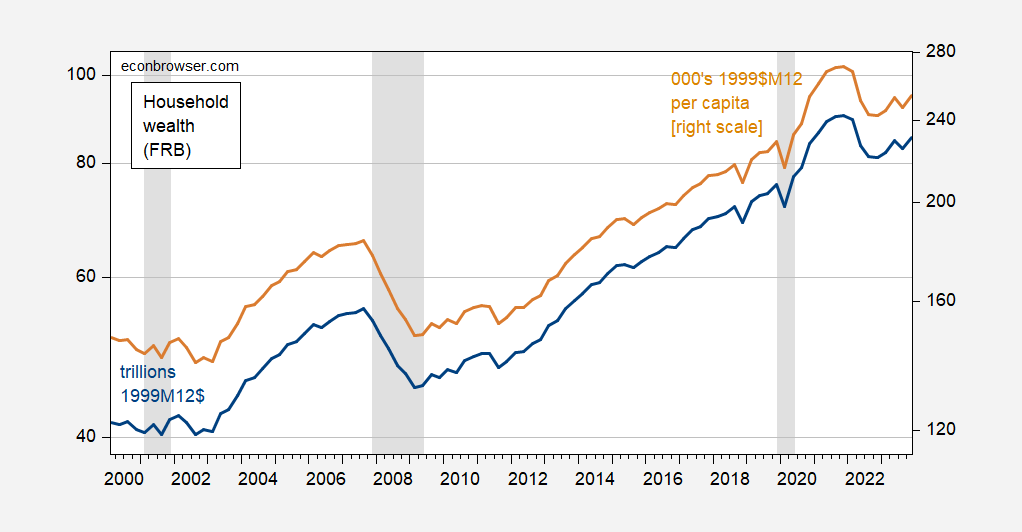
Figure 1: Household net worth, in trillions 1999M12 dollars (blue, left log scale), and per capita, in thousands of 1999M12 dollars. Deflated using chained CPI, seasonally adjusted by author using X-13. NBER defined peak-to-trough recession dates. Source: Federal Reserve Board Flow of Funds via FRED, BLS, NBER, and author’s calculations.
The Fed provides a picture of the composition of changes of net wealth (in trillions of dollars).
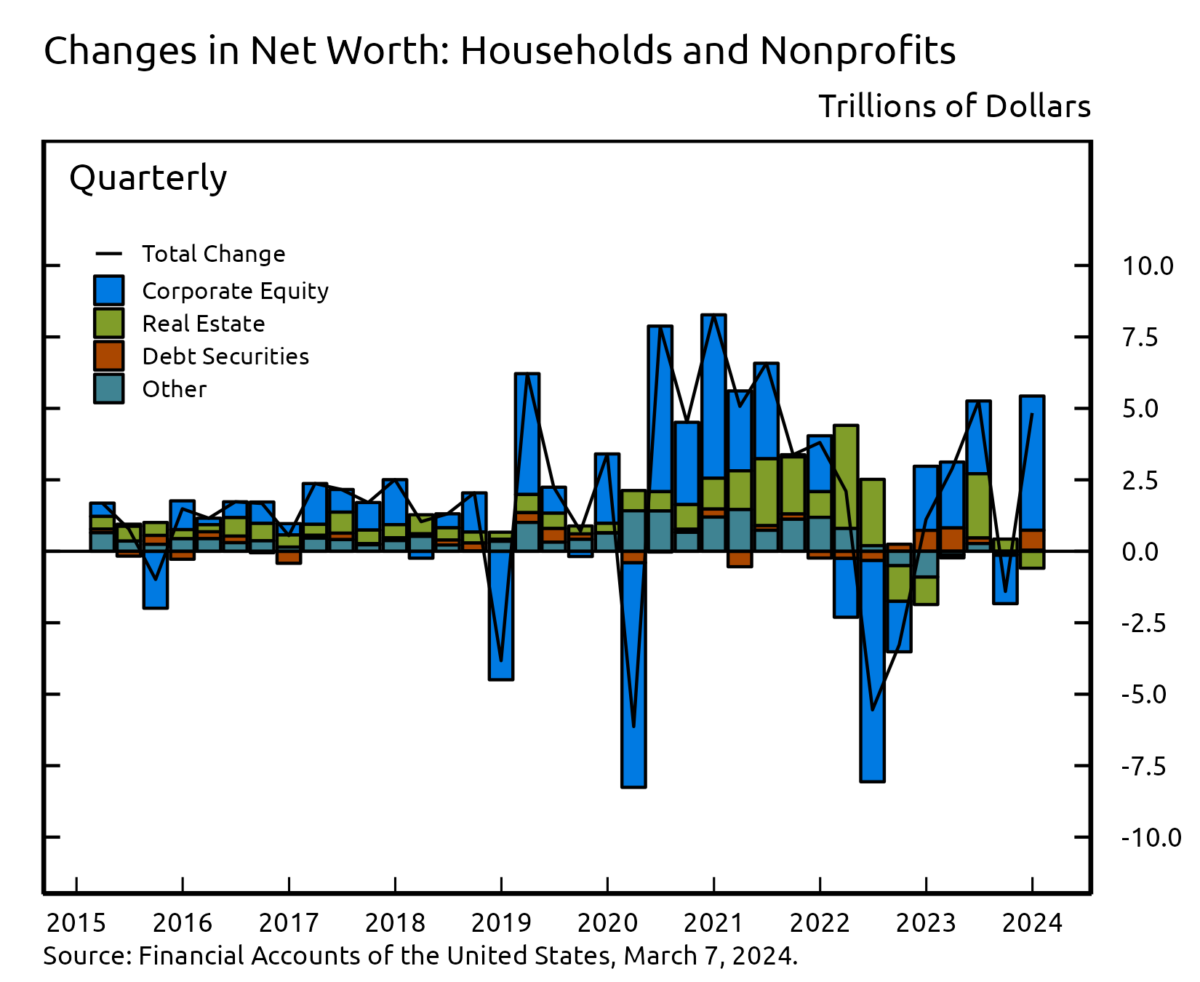
Source: Federal Reserve Board.
Off topic – Israel’s fiscal situation in wartime:
Israel’s war costs have required an substantial expansion of the deficit. As Reuters report the budget under consideration, “the budget deficit (will be) raised to 6.6% of gross domestic product from a prior 2.25%.”
As a result, Israel has just held a record-large $8 billion debt auction, the first debt auction since Israel’s ratings downgrade:
https://www.reuters.com/markets/rates-bonds/israel-sells-record-8-billion-bonds-despite-oct-7-attacks-downgrade-2024-03-06/
As I understand it, the U.S. Treasury guarantees this debt, which makes this paragraph rather curious:
“Results of the bond offering showed that Israel would pay 135 basis points over comparable 5-year U.S. Treasuries, 145 basis points over 10-year Treasuries and 175 basis points over U.S. 30-year bonds – about 25 to 30 basis points below initial guidance.”
If the Treasury guarantee is credible, then those spreads represent a liquidity premium? Seems unlikely. Even if the guarantee isn’t credible, these spreads are all wider than current U.S. corporate BBB spreads, which are around 123 basis points. Israel’s sovereign rating is now A2.
Lithuania, with a ratings profile similar to Israel’s across the big ratings agencies, currently borrows at ten years for about 47 basis points LESS that Treasuries, and Lithuania also lives In a rough neighborhood, without a U.S. guarantee for its bonds.
By the way, this sale was handled as a private placement, not a public issuance, so no prospectus was available to the public. The whole thing is sketchy.
Net worth, both overall and per capita, appear to roughly on the 2016-2019 trend.
A troubling distributional issue is that debt is rising among the young and less well-off, while gross wealth only rises among holders of wealth. For those in the middle, age is a big factor, as debt – especially mortgage debt – is extinguished over the years. So the mature middle is stretching its lead over the young and the poor. As for the rich, well, Biden’s tax proposal would help.
Net worth held by Top 0.1%.
https://fred.stlouisfed.org/series/WFRBLTP1246
The usual suspects made out since 2019like the bandits they are. Meanwhile real wages stagnated, rising only last year as inflation eased.
Distribution matters.
JohnH: Since I had to remind you of the distributional national accounts, this seems pretty rich from you.
‘Net Worth Held by the Top 0.1%’
Let’s see – nominal wealth rose over the past 34 years. No account for how this looks in real terms or in comparison to any other group? We get Jonny boy is incompetent but damn!
Yes, distribution matters. Your link does not, however, show distribution. It shows level, which, as pgl points out, isn’t how it’s done.
If one actually wanted wanted to know about changes in distribution, one might look at shares of wealth over time. Here’s the share of total household net worth held by the lower half of the wealth distribution:
https://fred.stlouisfed.org/series/WFRBSB50215
The lower half lost relative position during the Bush Jr. administration, then began to gain share under Obama. That gain continued in more or less uninterrupted fashion until the recent bout of inflation.
The lower 50% of households by wealth hold tiny fraction of total wealth – everybody knew that, right? – but have made gains over the years.
Meanwhile, take a gander at what happened to the relative wealth of the 90th to 99th percentile:
https://fred.stlouisfed.org/series/WFRBSN09161
The combined effect of stock and fixed income losses after the Covid recession erased years of gains in relative position. That’s because the to ten-ish percent of wealth holders have more financial assets relative to residential real estate assets than poorer groups.
Top 1%? Kinda stagnant for the past decade:
https://fred.stlouisfed.org/series/WFRBST01134
So Johnny got that wrong. But then, he made a claim about an economic fact, so it’s axiomatic that he got it wrong.
Ready for the big reveal? The 50th to 90th percentiles have really turned it around since the Covid recession:
https://fred.stlouisfed.org/series/WFRBSN40188
Might say they’ve made out like bandits. You might also say that this attempt by Johnny to stir up resentment was, to quote pgl, incompetent.
This mostly seem to be driven by the stock market – the biggest money printing machine in history. Maybe we need to put the stock market on a gold standard.
I seems that the rise in net worth of the Top 0.1% has been greeted here with a gigantic “meh!,” I guess the problem needs to be put into better perspective.
The Top 0.1% in net worth consists of about 132,000 households, about 0.1% of all US households.
Their net worth increased by $6.5 Trillion between 2019 and 2023. The rise stemmed mostly from asset appreciation–income resulting from unrealized capital gains.
Total national income from wages income of all 129 million US households was $11.8 Trillion in 2023.
In other words, in four short years the Top 0.1% (132,000 households) was able to garner via asset appreciation an amount equivalent to half of the entire nation’s (129 million households) annual earned income. And nowhere does the BEA even report on income that comes in the form of unrealized capital gains! It is essentially hidden from public view.
But let’s not talk about that! I mean, it’s not as if 61% of Democrats think that reducing economic inequality should be a top priority for the government. Or that 78% say there’s too much economic inequality in the U.S. these days.
Obviously, it’s better for mainstream economists to turn a blind eye to a major contemporary problem directly related to economics and public policy! As I pointed out earlier, neither Menzie’s macroeconomics syllabus nor the UW-Madison economics department’s website deigns to mention inequality! The Blanchard textbook used for the course dedicates a virtually insignificant 8 pages out of 500+ to wage inequality.
It might also be worth mentioning that there are some who are rising to the occasion–Jaime Galbraith is teaching an entire course on inequality!] https://lbj.utexas.edu/galbraith-james-k
I actually downloaded the timeseries https://fred.stlouisfed.org/series/WFRBLTP1246 of the net worth of the top 0.1% and did some analysis of it. On a log scale, the last few quarters of net worth are dead on trend for net worth from mid-2010 onwards (2% per quarter, on the log scale, not inflation-adjusted.) The quarterly growth over that period is significantly lower than over the previous two expansions, starting in 1989 and 2003. If the growth rate of the first of those two periods had held over the 2010 – present period, the net worth would have been about 26% higher; if the growth rate of the second (Bush) expansion had held, the net worth would have been about 150% (!) higher.
The same model, run on the net wealth of the bottom 50%, indicates a 7% quarterly growth rate over 2011 – present (the Great Recession seems to have lasted about one year longer for the bottom 50% than for the top 0.1%.) This is far higher than the roughly 1 – 1.5% growth rates during the previous two expansions.
Wealth inequality in America is, IMO, disgracefully high, but things do seem to be improving somewhat.
Yes. Exactly. Johnny lied, of course, when he said the reaction here was “meh”. The reaction has been to point out that the disparity in wealth is large, but that some less-well-off groups are doing better. Johnny wants us to notice the disparity, but not the improvement for less-well-off groups.
@ JohnH
Did your mother drop on the head when you were a small child??
https://www.irp.wisc.edu/research/inequality-mobility/
https://research.wisc.edu/funding/understanding-and-reducing-inequalities-initiative/
https://guide.wisc.edu/courses/econ/
Read slowly JohnH and pay special attention to course “ECON 370”
The only “meh” was to little Jonny boy totally failing to contribute to the discussion. It seems the adults here did take up my challenge even if little Jonny boy failed to do so again. OK worthless liar – go read their comments. And have your mommy change that stinking diaper.
Comparing income per year for one group to wealth for another group is beyond stupid. Then again you are rhe dumbest person ever