Here’s a picture of the key indicators followed by the NBER Business Cycle Dating Committee used in their business cycle chronology:
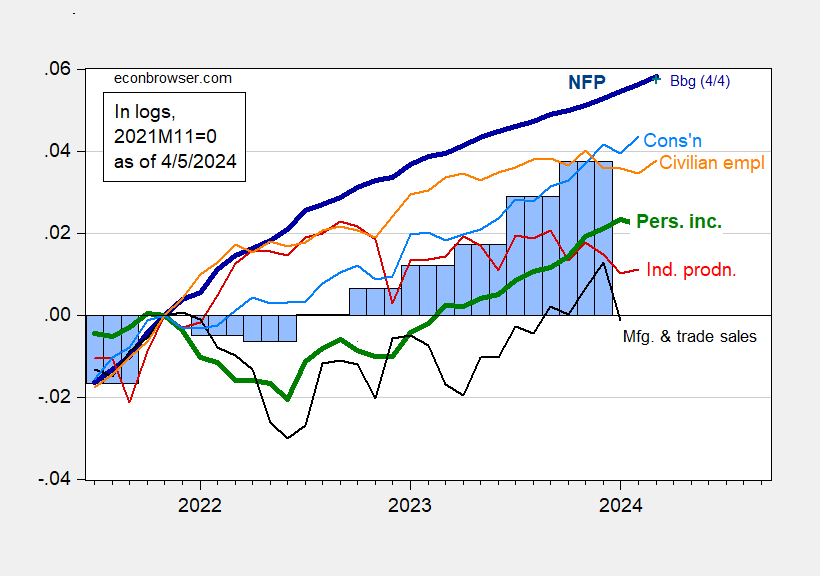
Figure 1: Nonfarm Payroll employment from CES (bold blue), from Philadelphia Fed early benchmark (teal), civilian employment (orange), industrial production (red), personal income excluding current transfers in Ch.2017$ (bold green), manufacturing and trade sales in Ch.2017$ (black), consumption in Ch.2017$ (light blue), and monthly GDP in Ch.2017$ (pink), GDP, 3rd release (blue bars), all log normalized to 2021M11=0. Source: BLS via FRED, Federal Reserve, BEA 2023Q4 2nd release, S&P Global Market Insights (nee Macroeconomic Advisers, IHS Markit) (3/1/2024 release), and author’s calculations.
We can be fairly sure that employment growth is positive. See alternative indicators in this post.
Here are some alternative indicators of economic activity.
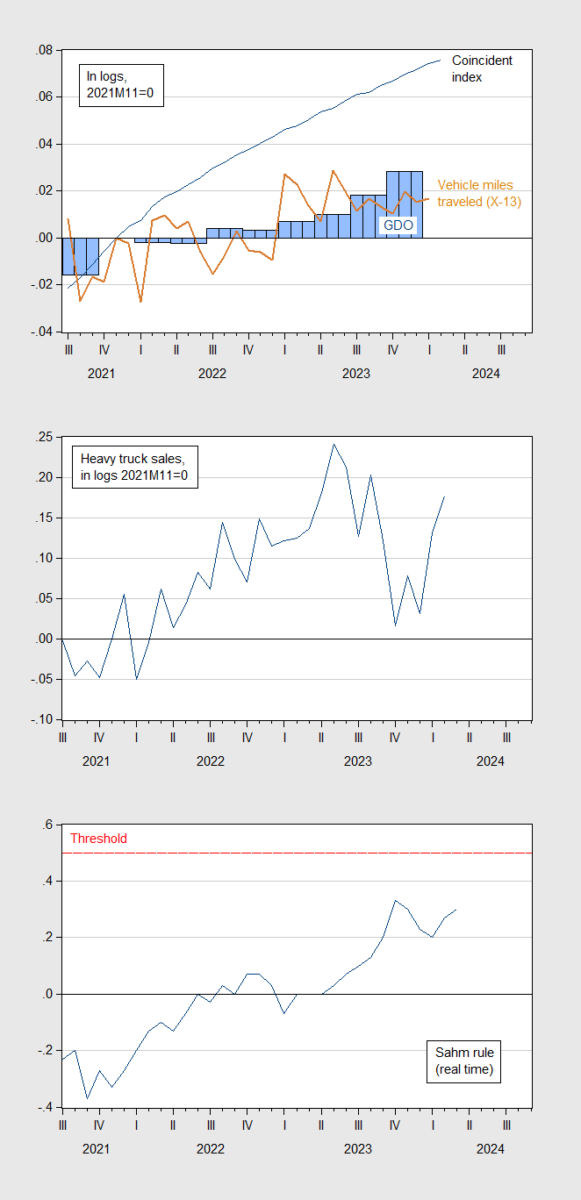
Figure 2: Top panel: GDO (blue bar), coincident index (blue line), and vehicle miles traveled seasonally adjusted by author using X-13 (tan line), all in logs, 2021M11=0; Middle panel: Heavy truck sales, SAAR, (blue line), all in in logs, 2021M11=0; Bottom panel: Real time Sahm rule (blue), and recession threshold (red dashed line). Source: BEA, Philadelphia Fed, NHTSA, Census, FRED, and author’s calculations.
None of the indicators clearly signal the onset of a recession, although vehicle miles traveled has flattened out, with y/y growth in January -0.8 %.
Off topic – China’s local government finance vehicles:
https://www.cogitations.co/p/the-rise-and-fall-of-lgfvs
Here’s a taste:
“LGFV’s financial situation is, to put it frankly, very bad. In aggregate, earnings (before interest, taxes, and depreciation, i.e., EBITDA) do not cover even their interest payments. Including government subsidies only occasionally pushes the interest coverage ratio above one. Moreover, the average borrowing cost for LGFVs, 5% or so, far outpaces their 1% return on assets, posing obvious sustainability problems.”
This passage doesn’t mention the size of LGFVs, but others do, and they are large relative to China’s GDP. Got that? Large relative to GDP is always a worry, but large relative to China’s? Eeks.
The article offers lots of data, though I have questions about completeness, since only 3,000 of the 12,000 LGFVs publish financials. Again, eeks.
Sine is a youngster, but writes well and avoids most of the flaws of SEO writing and “counting eyeballs” journalism.
Return on assets = 1% and cost of debt = 5% is really bad unless the organization is named Trump something.
“only 3,000 of the 12,000 LGFVs publish financials”
One reason companies do not report financials as their financial situation is poor. That the 3000 that do report financials are so bad – one should be very concerned.
“although vehicle miles traveled has flattened out, with y/y growth in January -0.8 %.”
Expect the world’s worst consultant (Princeton Steve) to write one of his idiotic blog post noting the weakness in VMT as a sure sign (according to Steve) that we are already seeing the 2024 recession. After all – he did tell us all about that 2022 recession.