Following up on Jim’s post yesterday, thoughts on measurement error and prospects. Note that GDP surprised on the downside, at 1.6 ppts q/q AR vs. consensus 2.5 ppts. On the other hand, GDP+ grows faster, as does final sales to private domestic purchasers.
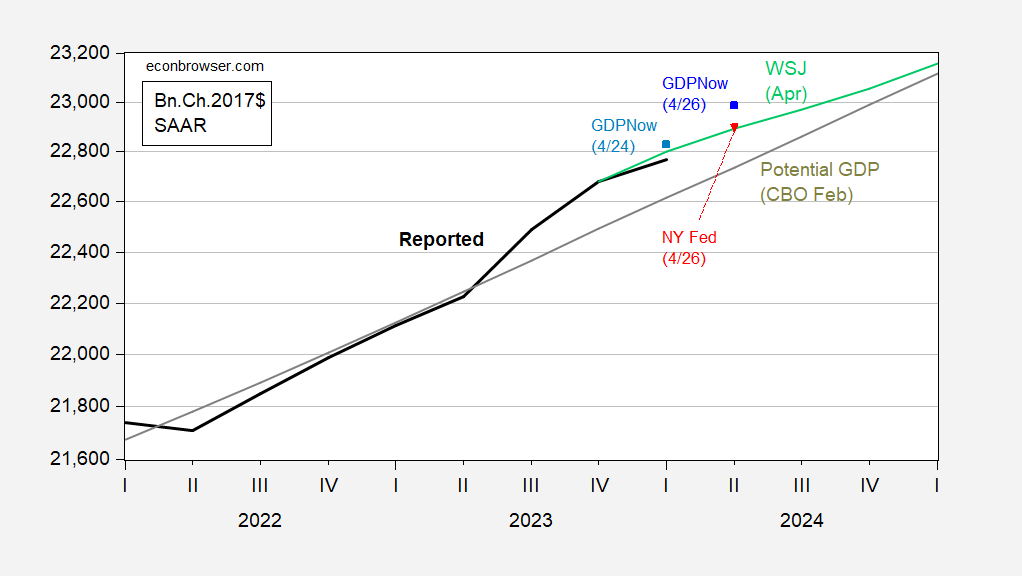
Figure 1: GDP (bold black), GDPNow as of 4/24 (light blue square), GDPNow as of 4/26 (blue square), NY Fed nowcast as of 4/26 (red inverted triangle), April WSJ survey mean (light green), CBO estimate of potential GDP (gray), all in bn.Ch.2017$ SAAR. Source: BEA (2024Q1 advance), Atlanta Fed, NY Fed, CBO Budget and Economic Outlook (February 2024), and author’s calculations.
While 1.6 ppts seems far below 2.5 ppts (q/q AR), recall that this advance estimate will be revised, perhaps substantially. As noted in this BEA note from October 2023 (for sample period 1996-2022):
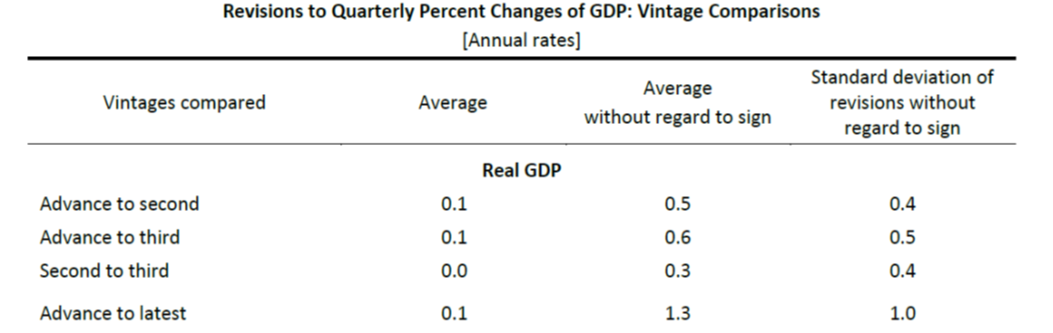
Source: BEA (2023).
What about alternative measures of economic activity. Below I plot reported (expenditure side) GDP, GDO (the average of GDI and GDP), and GDP+, and in a separate graph, final sales to private domestic purchasers, which is often interpreted as a better measure of aggregate demand.
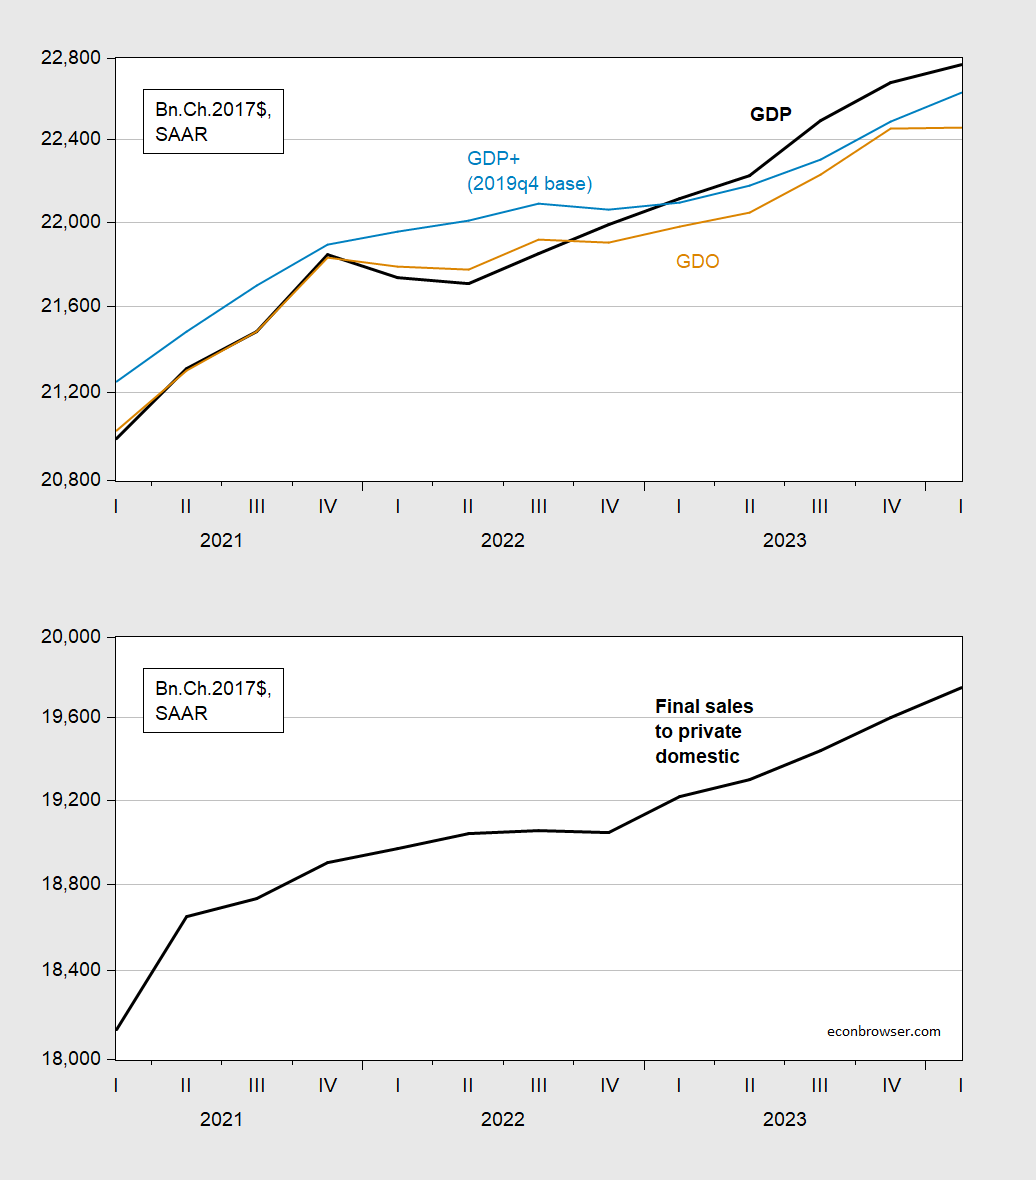
Figure 2: Top panel: GDP (bold black), GDO (tan), GDP+ indexed to level of 2019Q4 GDP (light blue). Bottom panel: Final sales to private domestic purchasers (bold black). All in bn.Ch.2017$ SAAR. GDI is estimated based on 2.2% y/y growth on net operating surplus component. Source: BEA 2024Q1 advance release, Philadelphia Fed, and author’s calculations.
On a q/q AR basis, estimated GDO is not growing at all. The missing component of GDI I filled in with a 2.2% growth in net operating surplus, using a 2.2% forecasted growth in corporate earnings for Q1. This means that real net operating surplus is assumed to resume its decline in Q1.
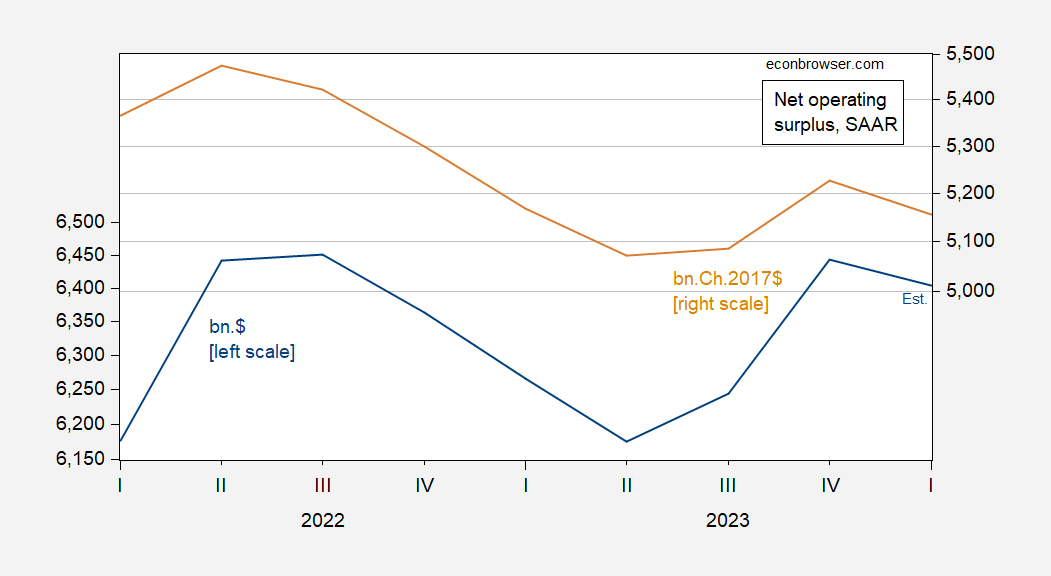
Figure 3: Net operating surplus in bn.$ SAAR (blue, left scale), and in bn.Ch.2017$, SAAR (tan, right scale). Deflated using GDP deflator. Source: BEA and author’s calculations.
While both GDO and GDP+ have decelerated (the former to 0 ppts), final sales continues apace (3% q/q AR), suggesting continued momentum in aggregate demand.
As to business profits, NABE respondents report gains, on average. That’s not the same basis as in GDP accounting, only a slice of business and not quantifiable, but offers food for thought.
https://nabe.com/NABE/Surveys/Business_Conditions_Surveys/April-2024-Business-Conditions-Survey-Summary.aspx
My perception of Prof Chinn’s comments is that he thinks the GDP numbers will most likely be revised upward. One thing is for sure, it’s going to be interesting to watch as we slowly move on to November.