Are you better of than you expected four years ago? I use trend growth 2016-2019 to figure out what is “expected”.
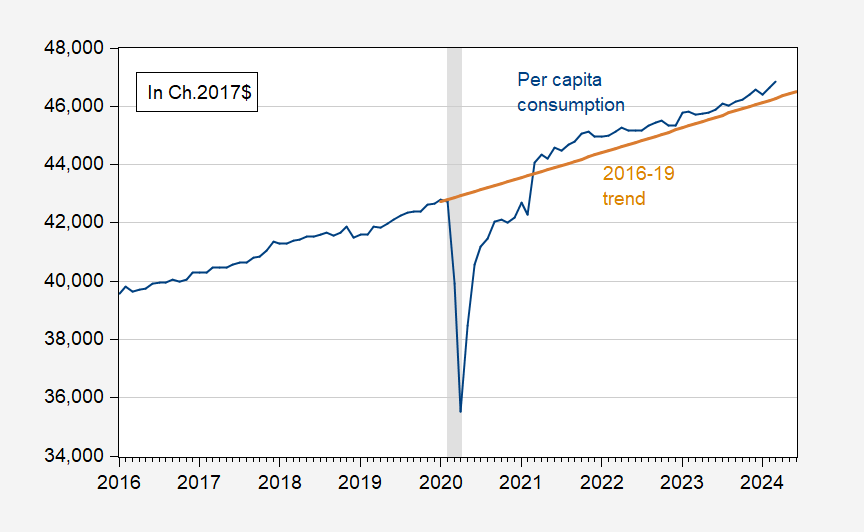
Figure 1: Consumption per capita in Ch.2017$, calculated using consumption divided by population (blue), and 2016-19 (stochastic) trend (tan). NBER defined peak-to-trough recession dates shaded gray. Source: BEA, Census via FRED, NBER, and author’s calculations.
I guess one can say it depends on what one is consuming. Princeton Stevie boy is not happy with his consumption apparently. Maybe it is because Stevie figured out paying $400 for his Trump basketball shoes was a bit too much. Then again Bruce Hall is delighted that he had to pay only $60 for his Trump bible.
Above-trend real consumption is a central feature of the post-Covid-recession expansion. Income support for households and wage gains for lower-wage workers both contribute.
To the extent that consumption = welfare (a dangerous simplification), it’s clear that the average Jo(e) is not only better off than before Covid struck, but is better off than could reasonably be expected.
The simplification leaves out a lot of intangibles, like fires, floods and fear. “What about health? What about climate change? What about access to insurance? What about access to medical care?” All valid concerns, all deleterious to peace of mind. All reasonable subjects for governmental fixes.
Off topic – The IRS has received additional funding under the Inflation Reduction Act, partly to improve tax collection. That effort will include expanded audits. The Hill reports on audit targets:
https://thehill.com/homenews/nexstar_media_wire/4639729-the-irs-is-overhauling-how-it-audits-heres-who-is-a-target/
They include:
• Wealthy individuals whose income tops $10 million
• Companies with assets above $250 million
• Complex partnerships with assets more than $10 million
• Corporations and high-income taxpayers using business aircraft, like private jets, for personal use
One improvement (?) in audit efforts will be increased use of automated systems to develop audit cases. The IRS will also cut back on audits of poor black families, who are 4.7 times more likely to be audited than the average household, due in part to claiming earned income tax credits.
There is a Santa Claus.
It seems odd that https://fred.stlouisfed.org/series/PCESC96 appears to be below the 2016-19 linear trend while https://fred.stlouisfed.org/series/PCEC96#0 is above (not per capita basis). If total expenditures are above the earlier trend and expenditures for services below, it would seem that goods must be well above trend. And, voila, that is the case https://fred.stlouisfed.org/series/PCEDGC96.
A lot of catching up to do on durable goods that were not available during the epidemic shutdowns. A good example of a rebound from an artifically created shortage.
Sort of like “job creation”.
Wait – people are consuming more overall but the mix has turned more to goods rather than services. How could that be? On yes – sometime called a pandemic. Gee Brucie – I guess you never heard of COVID19. DUH!
Real Personal Consumption Expenditures: Durable Goods
That’s your graph but your comment mentioned good in general. Ever heard of nondurable goods? Or do you eat cars for breakfast?
Come on Brucie – I would have thought no one is THIS STUPID. Then again – you often prove you are dumber than a rock..
” it would seem that goods must be well above trend. And, voila, that is the case”
I just went to the NIPA accounts over at http://www.bea.gov. It seems consumption spending on goods was around $6.2 trillion but only $2.2 trillion was spent on durable goods (Brucie’s little graph). Gee Americans spent $4 trillion on nondurable goods – something little Brucie boy never heard of.
Come on Brucie – no one is this bad at evaluating data. Except you of course.
I bet the Trump campaign, or some Trump friendly economist/pundit/nitwit will use a version of this graph that truncates the time period from 2016 to 2021 to lie about we’re all living in some sort of stagflationary wasteland. “See, everything went to hell under Biden!”
I wouldn’t mind seeing a version of this graph that starts the timeline in 2000. I lack the math skills to do this using FRED—but I think a comparison of the Great Recession to the Pandemic would be informative.
https://fred.stlouisfed.org/graph/?g=1myrT
You’ll need to draw your own line. Enjoy.
https://www.bls.gov/news.release/empsit.nr0.htm
THE EMPLOYMENT SITUATION — APRIL 2024
Total nonfarm payroll employment increased by 175,000 in April, and the unemployment rate changed little at 3.9 percent, the U.S. Bureau of Labor Statistics reported today. Job gains occurred in health care, in social assistance, and in transportation and warehousing.
The unemployment rate edged up slightly as the Household Survey suggested employment growth was only 25,000. Expect Faux Business to declare the Household Survey as the most reliable measure.
Real-time Sahm rule is at 0.37, which is not recessionary:
https://fred.stlouisfed.org/graph/?g=1mzJM
However, other than immediately after recession, this version of the Sahm rule has only reached this level three times, each only briefly, without a recession following very soon after. March 1963 matched the April reading. November 1967 and December 1976 both hit 0.47.
There has been a modest downward shift of the refunds futures curve since the release of the data. Ten-year yield down six basis points.
The Sahm rule is based on the unemployment rate which uses the household survey measure of employment. The recent rise in the unemployment rate came from the fact that the household survey may have understated employment growth.
A bit longer term. The unemployment rate in early 2023 was 3.4%. It is now 3.9%. Yet the household survey measure of the employment to population ratio has not changed that much. What has changed is the labor force participation rate which has increased considerably.
Since the St. Louis Fed already calculates per capital consumption (nominal), wouldn’t it be simpler to use these data and adjust with CPI?
https://fred.stlouisfed.org/series/A794RC0Q052SBEA
Also, my earlier comment (which hasn’t appeared and may not have gone through) regarding personal consumption (not per capita) for services was below trend while for goods above trend indicating, perhaps, a rebound effect from shortages in 2020-21.
https://fred.stlouisfed.org/series/PCESC96
https://fred.stlouisfed.org/series/DGDSRX1
Maybe someone forgot to tell Brucie boy – but your latter two links use the PCE deflator not CPI to convert nominal to real. Oh wait – this has been covered here many times before. But little Brucie forgot to read those posts too.
I guess I hit post comment too quickly since the St. Louis Fed also publishes the real per capital personal expenditures. So one could calculate the linear trend line for any prior period and extend that to compare with 2021-24.
https://fred.stlouisfed.org/series/A794RX0Q048SBEA
Bruce Hall: To my knowledge, what I’ve got is similar to what is BEA series. We *could* use CPI, but BEA uses PCE deflator to do it’s calculations of real per capita consumption.
Exactly. We have covered this many times before. One has to wonder if Brucie bothers to actually read these posts here.
From your graph:
‘Figure 1: Consumption per capita in Ch.2017$’
Brucie – did you read the legend of his graph? Maybe future blog posts need to be drawn in canyons for some readers.
The first difference is sometimes called the weight effect. In calculating an index number, which is a sort of average, some prices get a heavier weight than others. People spend more on some items than others, so they are a larger part of the basket and thus get more weight in the index. For example, spending is affected more if the price of gasoline rises than if the price of limes goes up. The two indexes have different estimates of the appropriate basket. The CPI is based on a survey of what households are buying; the PCE is based on surveys of what businesses are selling.
https://www.clevelandfed.org/publications/economic-trends/2014/et-20140417-pce-and-cpi-inflation-difference
I’ll admit that I’m not sure if the Fed’s use of the term “personal” relates to both household and business expenditure or just what individuals/households spend. If the latter, it would seem that inflation as measured by CPI would have more meaning for households and their perceptions.
Is this all you got from this excellent discussion? Come on Brucie – learn to READ an entire document sometime.
Speaking of weighting – CPI pretends that all this nation spends on health care represents a mere 8% of income. PCE properly notes we spend about twice that amount. AND since health care costs have fallen relative to the general price level, the lower PCE inflation (as compared to CPI) is due to this difference in weighting.
Dude – we covered this a while back. I guess little Brucie did not pay attention to that either.
Brucie boy – did you forget to read the DATE of your link?
‘04.17.2014’
TEN YEARS AGO!
They updated and expanded their research in a much more recent paper. The critical point I just made was in their later paper.
Come Brucie – why don’t you give a link to some paper written in the 19th century on the medicine of viral diseases? Maybe that would explain your stupidity when it came to COVID 19.
Bruce Hall is at it again – citing outdated and incomplete discussions all in the MAGA cause – this time over the use of CPI v. PCE. Let’s help out our clueless troll out with something written in late 2022 rather than early 2014:
https://economics.td.com/us-cpi-pce
Differences in scope are the most consequential in terms of the overall effect on the differences between PCE and CPI because they have a domino effect on other differences, such as relative weighting. CPI uses a narrower definition of consumer expenditures and only considers urban expenditures made directly by consumers. In contrast, PCE considers expenditures made by urban and rural consumers as well as expenditures made on their behalf by third parties. An example of this would be healthcare insurance providers, who purchase prescription drugs on behalf of patients. Healthcare related expenditures are the predominant source of divergence between PCE and CPI originating from this category, largely due to the inclusion of third-party expenditures in PCE. The BEA does not publish party-specific expenditure data, but we can tell by the difference in weights that PCE expenditures are far larger. The CPI weight for healthcare services is currently 7% (based on 2019-2020 data) while the PCE index weight for healthcare services for the same time period was more than twice that amount (16.8%).
Now if Brucie really thinks we spend only 7% of our income on health care, then he is dumber than we give him credit for.
Aw, c’mon man. You’re using some private bank economist as your expert. After all the times you’ve mocked what bank economists write. Be consistent, man. You could cite a Federal Reserve paper instead. I’ll wait. You accuse me of cherry picking and then you go do it. Admit it. Economists don’t agree because economics is not a science. But nice opinion.
But to the real point, there is a discussion from the Federal Reserve in 2019 (oh, that’s so ancient by your reckoning) that discusses the machinations necessary to try to smooth out the more volatile aspects of inflation indices. The interesting thing is that since the PCE runs consistently 2pp below CPI, it accomplishes two things: 1) it lets the government tell consumers that inflation isn’t nearly as high as they perceive and 2) it leads consumers to think the government is full of crap. Oh, we’re just excluding things like food and energy. Tell that to people who have to eat and drive.
https://www.federalreserve.gov/econres/notes/feds-notes/comparing-two-measures-of-core-inflation-20190802.html
Still, if you mess with “the basket of goods” enough, you can smooth out inflation and predict it better. The weather has always been sunny and will continue to be sunny because we’ve taken storms out of the definition of weather. It’s just some days will be sunnier than others. Those hurricanes are just in your imagination.
So, riddle me this Riddler, if the Fed says PCE (or one of its derivations) is so much better than CPI, why does the Fed publish this: https://fred.stlouisfed.org/series/A794RX0Q048SBEA
I know; they probably read Ralph Waldo Emerson’s “Self Reliance” and vowed not to have small minds.
“You’re using some private bank economist as your expert. After all the times you’ve mocked what bank economists write. Be consistent, man. You could cite a Federal Reserve paper instead.”
You can’t dispute the point — can you? I’ll making a call to our host to find that comment from your fellow troll JohnH where he accused the BEA of being political hacks for Biden by citing the PCE index as I noted to trolls like you and worthless JohnH that your Cleveland FED had a 2000 paper which noted precisely what this bank economist noted. I’m sure you saw this back then but we know you are way too dishonest to admit it.
OK I read the other 3 worthless paragraphs of your asinine comment and looked at your two links. Real point? You made no point. Now try again – is the proper weight for health care services only 8% or is it 16.8%. That is what has driven the differences between the two measures.
Come Brucie – this is not hard. A two year old could follow this discussion. But not little Brucie boy.
Tell you what troll – call us when you finally learn to tie your own shoe laces.
“Table 1: Highest Weighted Item Categories for PCE and CPI”
Hey Brucie baby boy – did you notice this table. Check the footnote. He sourced these weights from BEA and BLS.
Now are you saying these agencies lied? No little baby boy – you are the only liar here. MAGA!
“You could cite a Federal Reserve paper instead.”
This paper was noted in an earlier discussion:
https://www.clevelandfed.org/publications/economic-commentary/2020/ec-202006-cpi-pcepi-inflation-differential
The CPI–PCEPI Inflation Differential: Causes and Prospects
Wesley Janson Randal J. Verbrugge Carola Conces Binder
March 2020
Read it you little sniveling little LIAR. It’s the CLEVELAND Fed and it is where I got what I claimed. It is what gave that bank economist the idea to check the relative weights which he documented using BEA and BLS data.
Look Bruce – we get you are stupid. We get you refuse to read real economics. We get you lie 24/7. But accusing who actually contribute thoughtful points and are honest of lying is beyond the pale. Even for a MAGA moron like you.
Bruce Hall: (1) I don’t recall pgl disparaging private bank economists per se (other private sector economists, like Don Luskin perhaps). (2) the piece cited by pgl is pretty much straight from other (reputable) accounts, including BLS and BEA. By the way, you might find my 2008 blogpost on the distinctions between CPI and PCE deflator illuminating, insofar as it recounts the things that all mainstream economists know, and are not being hidden by the Illuminati. (3) Where do you get PCE deflator runs 2 pps below CPI? I use 0.45 ppts based on regression 1986-2019 (cited numerous times on Econbrowser). (4) Nobody says core is the right way to deflate to get things relative to cost of living. We refer to core as a possible way to extract a trend. (5) On your last question, why does Fed publish https://fred.stlouisfed.org/series/A794RX0Q048SBEA, I think it would be better to understand (5a) a semi-independent component of the Fed, called the Federal Reserve Bank of St. Louis disseminates the series in question, and (5b) which is *produced* and published by the Bureau of Economic Analysis, and (5c) which uses the PCE deflator which you had just (mistakenly) disparaged as running 2 pp below CPI.
“you might find my 2008 blogpost on the distinctions between CPI and PCE deflator”
I would love it if you provided a link to this classic.
pgl: Meant to include. I’ll ad to comment. Here it is: https://econbrowser.com/archives/2008/08/consumer_inflat
CPI inflation generally runs about 0.4 percentage points higher than PCE inflation. However, at its peak in the summer of 2022, CPI inflation was almost 2 full percentage points higher than PCE inflation (9.0% vs. 7.1%). The “wedge” between the two indexes narrowed in the second half of 2023 as inflation fell dramatically, but it has since widened again to an average of 0.7 percentage points in December, January, and February.
https://www.morningstar.com/markets/whats-difference-between-cpi-pce
It was incorrect to state that PCE runs 2 pts. (1.9 to be exact) lower than CPI… except when inflation was running its hottest 2 years ago… and consumer perceptions of inflation were at its worst. As Bill Clinton once famous said, “It depends on what the meaning of the word ‘is’ is.”
But thanks for the explanation about the Fed.
“However, at its peak in the summer of 2022, CPI inflation was almost 2 full percentage points higher than PCE inflation (9.0% vs. 7.1%).”
Oh the period where YOU claimed inflation was over 13%. Yea using NSA data for a 17 month period was a little sneaky of you.
BTW – we have told you MANY times why there was this difference – medical costs fell in relative terms and CPI severely underweights this factor. BTW the data I provided from that bank economist and the explanation of why this matters ala the CLEVELAND FED (2000) was also noted in Dr. Chinn’s blog post that he mentioned.
But I guess little Brucie was told by his MAGA masters to ignore all of that.
“consumer perceptions of inflation were at its worst.”
Leave it to a MAGA moron to care about perceptions even when they are wrong. Hey Brucie – this is an economist blog not some Faux News poll. Oh wait – you do not given a damn about getting the economics right. Got it!
“1) it lets the government tell consumers that inflation isn’t nearly as high as they perceive and 2) it leads consumers to think the government is full of crap.”
A while back JohnH peddled the asinine claim that BEA was underreporting inflation to support Biden. Yea – he was as repugnant as he was stupid. Apparently you want to go further with this Jack Welch type of insulting. No you little jerk – the BEA is staffed with professionals who honestly report the data in a consistent way.
Oh wait Brucie’s BOY Donald Trump would change all that and put in politically motivated liars in these government agencies. Hay Brucie – you nothing more than a politically motivated liar. Huh – maybe Trump will give you a job. MAGA
Okay, pgl, what was the question at the very beginning:
Are you better of than you expected four years ago? I use trend growth 2016-2019 to figure out what is “expected”.
If you are using an index that runs lower than most people relate to, then your adjustment to get to 2017$ is going to be smaller than those people perceived to be the case… because they are acutely aware of the price of “incidentals” like food and fuel. But you just get out there and tell them that they are really better off and that they just don’t understand economics. Have at it; have fun.
Have you seen Dr. Chinn’s latest post? You have been busted.
Hey Brucie – a little advice. If you find yourself in a deep hole over your head – stop digging.
I like to read Politico which is considered “left-center” by Media Bias Fact Check, though I don’t necessarily agree with all of their propositions. https://mediabiasfactcheck.com/politico/
They recently (is April 19, 2024 recent enough pgl?) ran an article Trump Is Misleading You With Covid-Era Statistics. So Is Biden. Not so much economic theory but good context and reasonably fair.
https://www.politico.com/news/magazine/2024/04/19/how-to-mislead-with-covid-era-statistics-00153176
Hey Brucie boy – our host has not one but TWO new posts that absolutely demolish your latest attempt to claim the Biden years were worse than the Trump years. Yep – Brucie ducks them and changes topic. Typical.
“It’s worth pointing out that Republicans also risked inflation under Trump by passing sweeping tax cuts when unemployment was already low, but that stimulus ended up working out fine, suggesting that — even a decade after the 2008 financial crisis — the economy still wasn’t meeting its full growth potential.”
Potential GDP! Remember when some MAGA moron claimed we were still below potential GDP so we could have two years of 4% growth? It seems Dr. Chinn’s most recent post on this destroyed this claim too. And poor little Brucie tucked his lying tail and ran away!
“Victoria Guida is an economics correspondent at POLITICO. She has spent her Washington career writing about bank regulations, monetary policy and trade negotiations. A Dallas native, she graduated from the University of Missouri with a double major in journalism and political science.”
Only a moron like Bruce Hall would expect that a journalist would write about economic theory. But it was a good account of how utterly eff’d up the economy was under Trump’s last year in office. And yea – Trump’s incompetence made the COVID crisis worse. But Trump was only following the “advice” of Bruce Hall.
Did you read her close? Pretty good!
And the decision for voters, at least as it relates to the economy, should really be about what kind of economic policy that they want next to tackle looming challenges: a housing crisis, geographic disparities in economic outcomes, lack of affordable child care that holds people back from fully participating in the workforce, rising interest payments on the federal debt, and the like. Let’s talk less about misleading statistics, and more about that.
Oh wait – Trump and his MAGA morons like Bruce Hall have no policy responses to these issues. So what do they do? Spread misleading statistics. Spot on!