Analysis of current economic conditions and policy
Friends Don’t Let Friends Think Only Bivariately
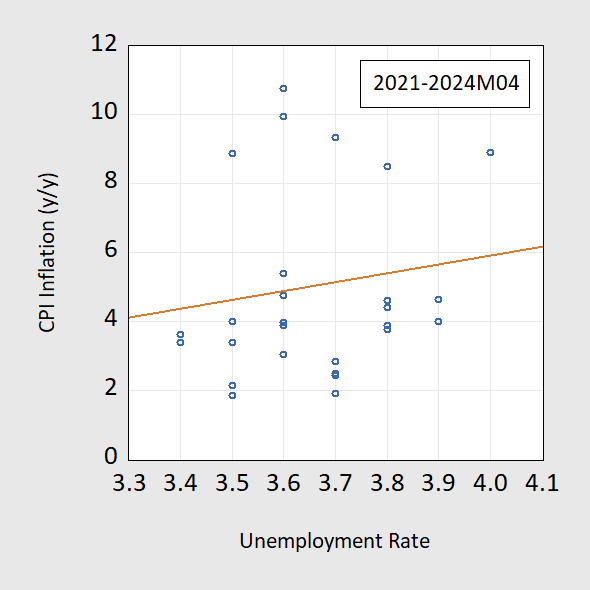
On thinking about today’s CPI numbers:
Figure 1: Year-on-Year CPI inflation, % vs. Unemployment rate, %. Source: BLS and author’s calculations.
Just sayin’.
2 thoughts on “Friends Don’t Let Friends Think Only Bivariately”
AS
A couple of my forecasts came close to reported, although not bivariate:
Food, FRED Series CPIFABSL
Reported M/M % = .02
Forecast M/M % =.05
Core CPI, FRED Series CPILFESL
Reported M/M % = 0.29%
Forecast M/M % = 0.34%
CPI Energy, FRED series, CPIENGSL was the surprise.
Reported M/M % = 1.1%
Forecast M/M % = 2.5%
For simplicity, if the M/M % change in energy were on the regression line as a function of the M/M % change in regular gas, FRED series GASREGW_d11, the monthly % change in energy would have increased by about 2.2% instead of 1.1%.
The M/M % change in energy inflation was off the regression line by more than I would have thought. Using dlog(gasregw_d11), the monthly % change in GASREGW_d11 was up about 3.4%.
pgl
The post “You have to look pretty hard to find the “trade war” effect in the data” mocked Bruce Hall’s attempt to smear me for simply suggesting manufacturing employment fell during the period between the start of Trump’s stupid trade war and COVID (employment clearly fell). Our host provided a lot of other data some of which we will come back to.
Brucie caught with his panties around his ankles started changing the subject and chirping a lot of other BS since Brucie can never admit he got the issue wrong. His latest had something to do with robots with another one of Brucie’s patented dishonest claims – “I realize pgl cannot comprehend how such an important metric as manufacturing employment could be irrelevant to the importance of manufacturing, but it is.” Like I never talk about overall production? Yea – Brucie is a pathetic little liar. But there is something really funny – Brucie boy missed the fact that manufacturing production over this period FELL by almost 5%!
Now since Brucie aka Mr. Magoo cannot see it either, here is a FRED graph!
Manufacturing Sector: Real Sectoral Output for All Workers
A couple of my forecasts came close to reported, although not bivariate:
Food, FRED Series CPIFABSL
Reported M/M % = .02
Forecast M/M % =.05
Core CPI, FRED Series CPILFESL
Reported M/M % = 0.29%
Forecast M/M % = 0.34%
CPI Energy, FRED series, CPIENGSL was the surprise.
Reported M/M % = 1.1%
Forecast M/M % = 2.5%
For simplicity, if the M/M % change in energy were on the regression line as a function of the M/M % change in regular gas, FRED series GASREGW_d11, the monthly % change in energy would have increased by about 2.2% instead of 1.1%.
The M/M % change in energy inflation was off the regression line by more than I would have thought. Using dlog(gasregw_d11), the monthly % change in GASREGW_d11 was up about 3.4%.
The post “You have to look pretty hard to find the “trade war” effect in the data” mocked Bruce Hall’s attempt to smear me for simply suggesting manufacturing employment fell during the period between the start of Trump’s stupid trade war and COVID (employment clearly fell). Our host provided a lot of other data some of which we will come back to.
Brucie caught with his panties around his ankles started changing the subject and chirping a lot of other BS since Brucie can never admit he got the issue wrong. His latest had something to do with robots with another one of Brucie’s patented dishonest claims – “I realize pgl cannot comprehend how such an important metric as manufacturing employment could be irrelevant to the importance of manufacturing, but it is.” Like I never talk about overall production? Yea – Brucie is a pathetic little liar. But there is something really funny – Brucie boy missed the fact that manufacturing production over this period FELL by almost 5%!
Now since Brucie aka Mr. Magoo cannot see it either, here is a FRED graph!
Manufacturing Sector: Real Sectoral Output for All Workers
https://fred.stlouisfed.org/series/OUTMS
Hey Brucie – do you need us to buy your a pair of glasses?