How certain are we about private NFP growth? Some worries from the Quarterly Census of Employment and Wages (QCEW) through December.
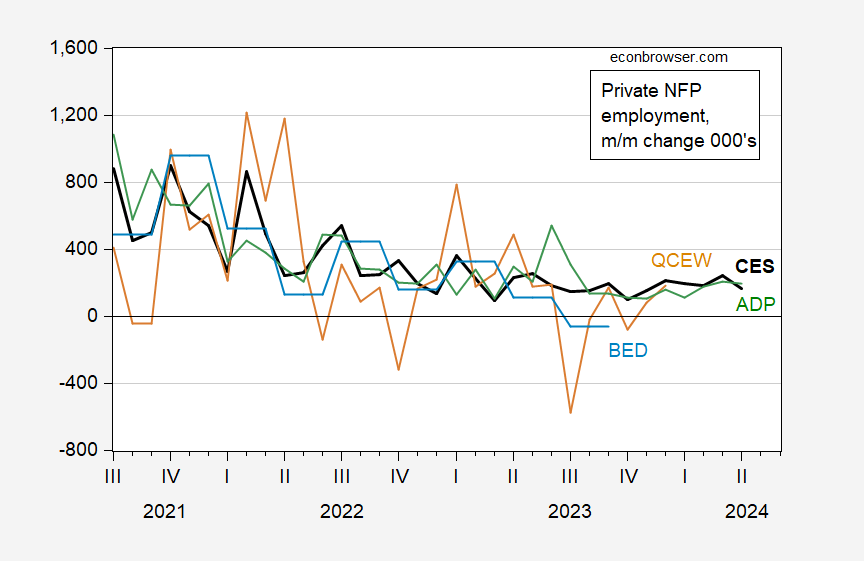
Figure 1: Month-on-month change in private nonfarm payroll employment from CES (bold black), from ADP (green), from QCEW seasonally adjusted by author using X-13 (tan), and from Business Employment Dynamics (light blue), all in 000’s. Source: BLS, ADP via FRED, and author’s calculations.
Employment changes (not growth rates) have converged as of end-Q4, although the QCEW change was significantly less in the Fall.
In levels:
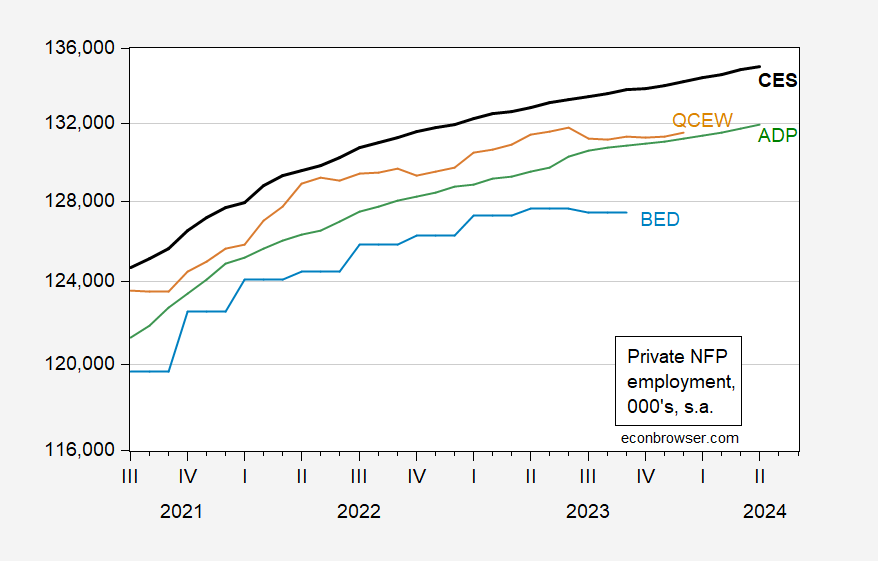
Figure 2: Level of private nonfarm payroll employment from CES (bold black), from ADP (green), from QCEW seasonally adjusted by author using X-13 (tan), and from Business Employment Dynamics changes accumulated on 2019Q4 level of private NFP from CES (light blue), all in 000’s. Source: BLS, ADP via FRED, and author’s calculations.
Covered QCEW (which differs in coverage from CES NFP) growth significantly slowed, as has the growth implied from the Business Employment Dynamics. On the other hand, the ADP series continued growth in line with the BLS series.
What about total NFP?
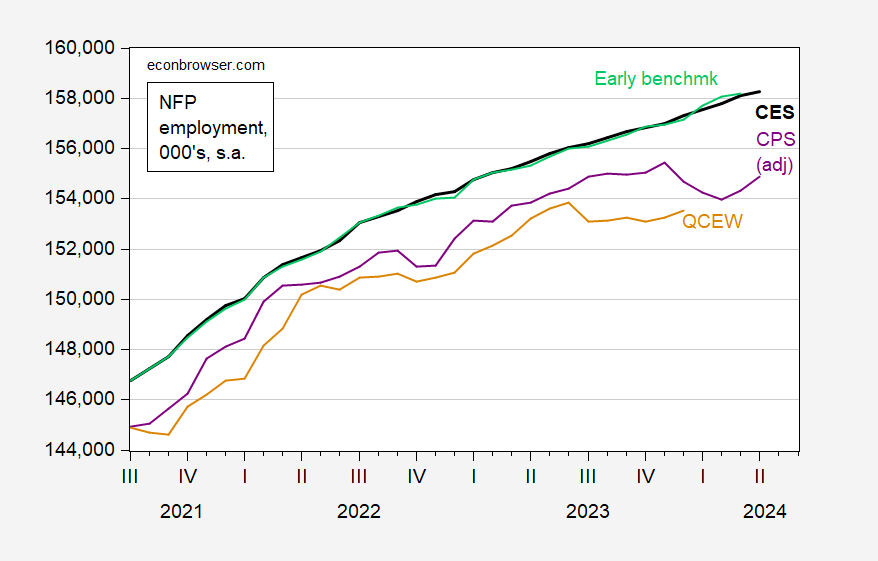
Figure 3: Level of nonfarm payroll employment from CES (bold black), from Philadelphia early benchmark (light green), from QCEW seasonally adjusted by author using X-13 (tan), and from Current Population Survey adjusted to NFP concept (purple), all in 000’s. Early benchmark calculated using ratio of sum-of-states early benchmark to sum-of-states. Source: BLS, Philadelphia Fed, and author’s calculations.
Here too QCEW has fallen sharply in growth. The most recent numbers will be revised over time as more administrative data comes in. The research series (CPS employment adjusted to NFP concept) shows a sharp drop, which might be associated with the new population controls introduced with the new year. What is reassuring is the Philadelphia Fed early benchmark series, which relies on QCEW data, stays pretty close to the official NFP series.


