At the beginning of April. Wisconsinites’ views on the state’s economy were fairly downbeat, despite some positive indicators [0]. On possible explanation is the perception of the economy’s state differs from respondent’s own conditions. Another possibility is that we have mismeasured the economy’s conditions.
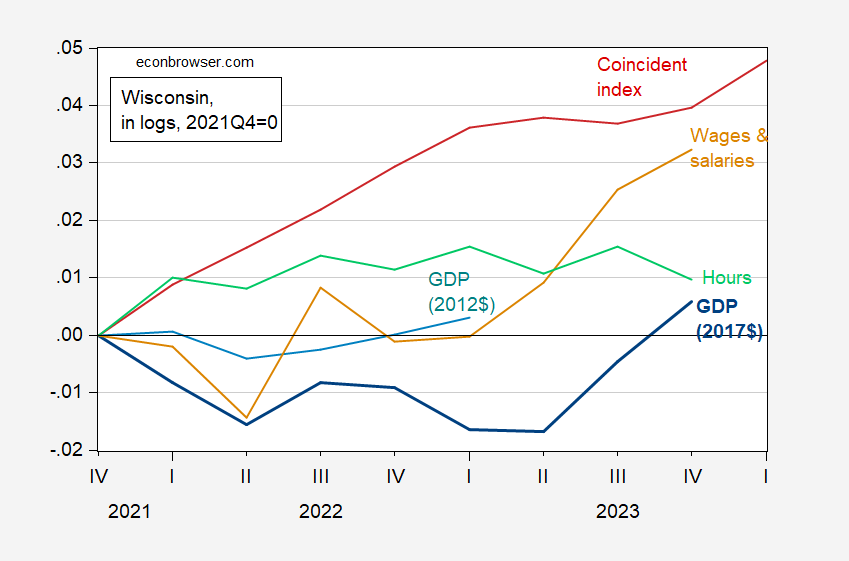
Figure 1: GDP (Ch.2017$) (bold dark blue), GDP (Ch.2012$) (light blue), wages and salaries deflated by PCE price index (tan), private sector hours (green), coincident index (red), all in logs 2021Q4=0. Hours calculated by multiplying private private employment by average weekly hours seasonally adjusted by author using X-13. Source: BEA, Census, BLS, Philadelphia Fed, and author’s calculations.
For instance, as of August of last year, real GDP growth looked respectable through 2023Q1. However, with the comprehensive revision of NIPA data incorporating additional and updated data, GDP growth looked pretty lackluster through 2023Q2. Growth only surged in 20243Q3-Q4. Why the large gap? Notes on the comprehensive revision are not illuminating on the exact source of the difference. What’s true is that, for instance, the California series do not exhibit such a large change in contours, so I suspect it’s something that has to do with how additional information impacts Wisconsin. Total wages and salaries were revised downward by about half a percentage point. Another issues is that the nation-wide prices are applied to Wisconsin sectoral values. Hence, if Wisconsin prices are systematically higher than nationwide, then real GDP will appear to be lower than the true values.
Real wages and salaries only picked up strongly in in Q2 (here using PCE deflator; using chained CPI, the cumulative increase by Q4 is only 2%). Finally, the Philadelphia Fed’s coincident index only started rising again, after plateauing through 2023, in the first quarter of this year.
While (preliminary) employment has leveled off in April, the coincident index — based on several labor market indicators — has surged.
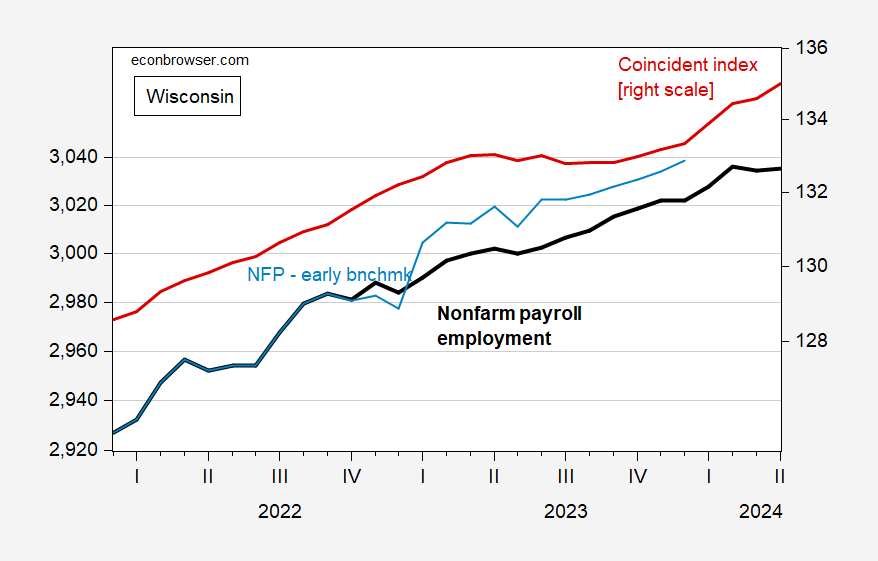
Figure 2: Nonfarm payroll employment (bold black, left scale), Philadelphia Fed early benchmark (light blue, left scale), and coincident index (red, right scale). Source: BLS, Philadelphia Fed [1], [2].