Headline CPI shows the second highest increase since 2021M01.
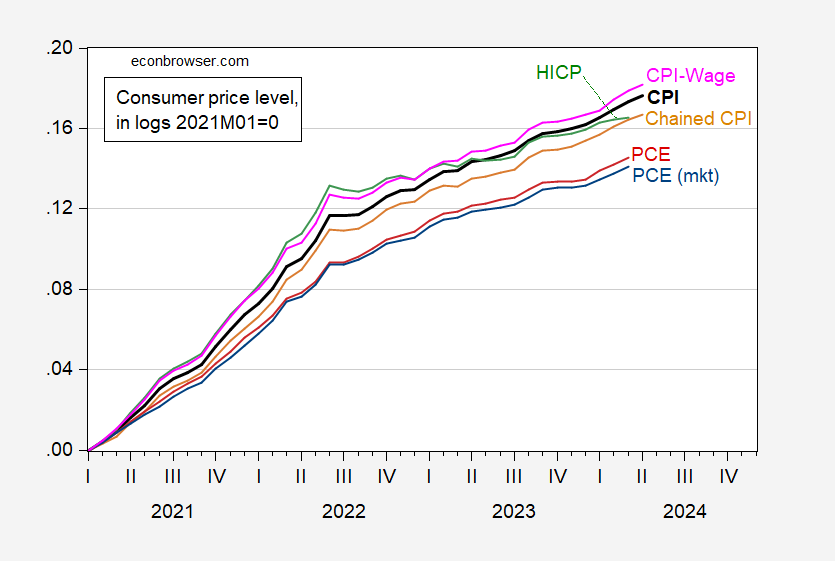
Figure 1: CPI all urban (bold black), CPI-wage and clerical workers (pink), chained CPI (tan), HICP (green), PCE deflator (red), PCE-market based (light blue), all seasonally adjusted, in logs 2021M01=0. Chained CPI, HICP seasonally adjusted by author using X-13 (log transform). Source: BLS, European Commission, BEA, via FRED, and author’s calculations.
Notice that despite the more frequent updating of weights in recent years’ worth of headline CPI, chained CPI (a research series) rises less. On the other hand, the CPI for wage and clerical workers rises slightly more than headline.
HICP rises less by March 2024 in part because it excludes owner occupied housing costs. It also covers rural consumers as well as urban.
Finally, the PCE (market based) increase is the smallest of all, less than even the conventional PCE.
The range of cumulative increase through March 2024 is 0.141 to 0.179 in log terms (i.e., 14% vs. 18%).
I think these might be an interesting numbers to keep track of as we ask the question “How much juice does the American consumer have left?”
https://fred.stlouisfed.org/series/DRCCLOBS
https://fred.stlouisfed.org/series/RCCCBBALTOT
https://fred.stlouisfed.org/series/RCCCBBALREV
https://fred.stlouisfed.org/series/CORCCOBS
https://fred.stlouisfed.org/series/DEMOTHCONS
https://fred.stlouisfed.org/series/RCCCBBALDPD90P
To me that suggests consumer spending is going to drop as we move on, certainly by December seasonal spending will drop. And the MAGA fans at the FOMC, including Jerome “Red Dunce Cap” Powell, will not need to raise rates any from here to December to watch consumer spending and the inflation rate to drop. And unless Powell wants to come out of the closet about his donald trump hard-on, he needs to leave FFR the F___ alone.
Yes, yes, yes! Time to write your PhD thesis.
Let’s think in terms of household balance sheets. Covid-recession transfers to households led to a drop in credit-card balances, delinquencies and the like. By the way, similar efforts were made to protect the balance sheets of businesses.
Your first link shows a period of high debt-payment delinquencies for some time after the 2000 and 2008 recessions, but not after the Covid recession. We’ve learned to avoid damage to balance sheets, and lower delinquencies is the result. The recovery from recession in the U.S. has been quite strong, almost certainly due in part to healthy balance sheets.
Now, the excess saving from all those transfer programs is gone. Delinquencies are at an extremely high rate, even without (as far as we know) recession. Truly odd.
With credit card borrowing rates, balances and delinquencies all high, we’re probably looking at an under-examined source of poor consumer moods.
I mention the Mian, Sufi and Verner stuff too often, I know, but here it is, again:
https://academic.oup.com/qje/article-abstract/132/4/1755/3854928
Rising household debt as a share of GDP is a leading indicator of recession in the medium term, with a particular role for mortgage debt. Where do we stand? Still in good shape, as of Q4:
https://fred.stlouisfed.org/series/HDTGPDUSQ163N
Does that mean we’re safe? Sure hope so, but could we run into a durables-debt cycle instead of a mortgage-debt cycle? Unprecedented credit-card delinquencies and the highest auto-loan delinquencies in a decade certainly raise the possibility.
By the way, Mian, Sufi and Verner found that countries with less flexible exchange rates are more vulnerable to debt cycles. China’s exchange rate is not all that flexible, and mortgage debt as a share of GDP hit a new high prior to the EverGrande splat. Household balance sheets are a mess in China.
Aaaaahh!!! You’re good for my ego Sir, good for my ego. I’ll take it!!! I’ll take it!!! (my ego’s a flimsy structure)
OK, rules of the road: Get back to me in December if I’m right on consumer spending dropping on a seasonal basis, and if I’m wrong by December we never had this discussion. Got it?? I call this “Rosser Rules”. Think of it as similar to Queensbury Rules, only just seedier.
Speaking of household balance sheets:
https://archive.ph/fIfih
The NYT has discovered what folks here have known for some time – the insurance industry is going through some big adjustments. More houses are becoming difficult or impossible to insure every day. Think what happens to household wealth when an uninsured house is damaged or destroyed. Heck, think what happens to household wealth when a house becomes uninsurable.
This problem is regional. We know from the mortgage crisis what happens when household wealth falls in a region. Growth, employment and wages in that region lag the rest of the country. And since a country is a bunch of regions, what happens in enough regions is what happens to the country.
So many interesting problems, so little time…
If a house cannot be insured then you probably could only sell it in a cash deal. That will quickly bring down the price of those houses in Florida.
Looks like two periods: linear with one slope up to 2022q3 and since that quarter and linear with another slope afterwards.
That structural break in the middle of 2022 is interesting. Do we know why it occurred?