CES measures indicate faster growth than others.
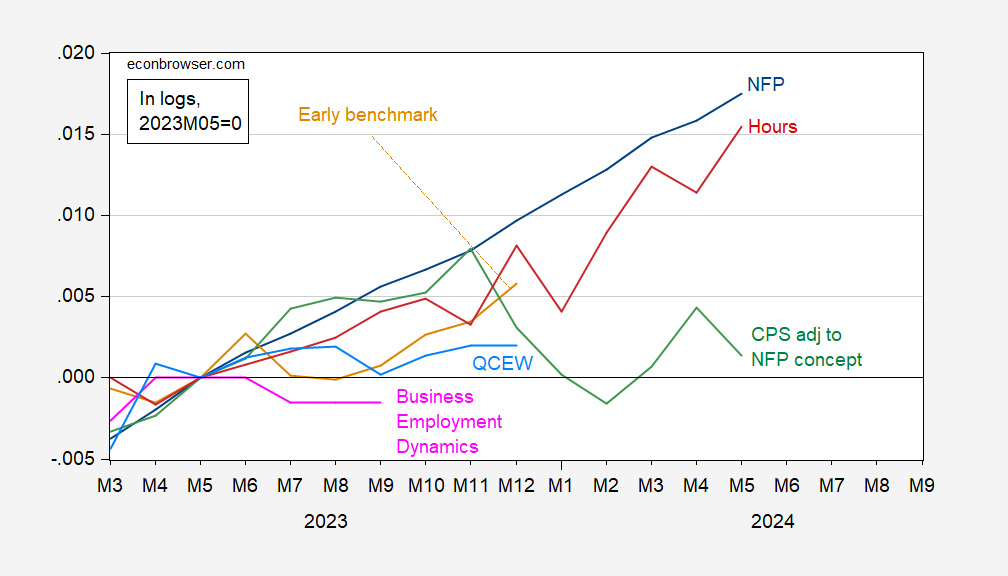
Figure 1: Nonfarm payroll employment (blue), early benchmark, calculated by adjusting actual using ratio of early benchmark sum of states to CES sum of states (tan), CPS measure adjusted to NFP concept (green), QCEW total covered employment seasonally adjusted by author by using geometric moving average (sky blue), Business Employment Dynamics net growth cumulated on 2019Q4 NFP (pink), and aggregate hours (red), all in logs, 2023M05=0. Source: BLS, Philadelphia Fed, and author’s calculations.
Some details: NFP is all workers, hours is for production and nonsupervisory workers, QCEW is total covered workers which differs from those covered by CES survey. The household survey (CPS) series is quite affected by the application of new population controls, with the January 2024 data. CBO has a higher estimate of the population, which would imply higher employment; see discussion by Edelberg and Watson (2024).
NFP is moving upwards faster than other measures, and could be affected by the birth/death model overestimating the number of firms. However, the coincidence of the private NFP from BLS survey and ADP works against that explanation.
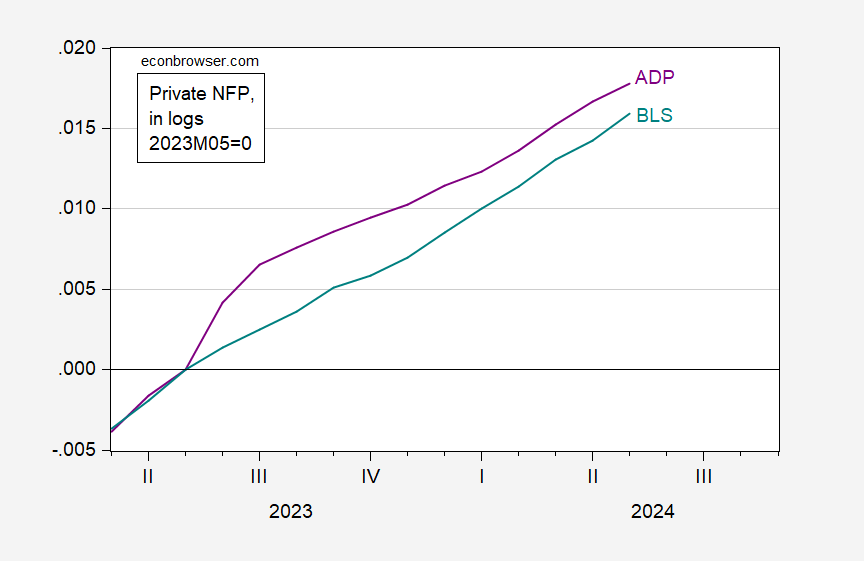
Figure 2: Private nonfarm payroll employment from CES (teal), from ADP (purple), s.a. Source: BLS, ADP via FRED, and author’s calculations.
Note that the revamped ADP-Stanford series is based on administrative data, and is no longer constructed to forecast the BLS series. Not only has the ADP-Stanford series risen move over the past year, the growth rates over the last three months are comparable.
I don’t know why I haven’t thought of this before – embarrassing.
Covered employment (those coverd by state unemployment benefits programs) is up 3,628,863 from a year ago (week of May 18). That’s a 2.5% increase.
Covered employment, like ADP, is an actual count, not an estimate. Covered employment is obviously different from total employment, a lower number except when total employment declines sharply:
https://fred.stlouisfed.org/graph/?g=1oP96
Covered employment is currently at about 95% of total employment, up from 91% at the post-recession low.
By the way, part-time employment has recently risen as a share of totL employment, a factor which may be holding covered employment down:
https://fred.stlouisfed.org/graph/?g=1oPa1
Has native-born employment really dropped 300,000 over the past year?
https://jabberwocking.com/has-native-born-employment-really-dropped-300000-over-the-past-year/
Kevin Drum spots the latest spin from immigration hawks and exposes the truth that you may already know.