NFP at +206K vs +191K.
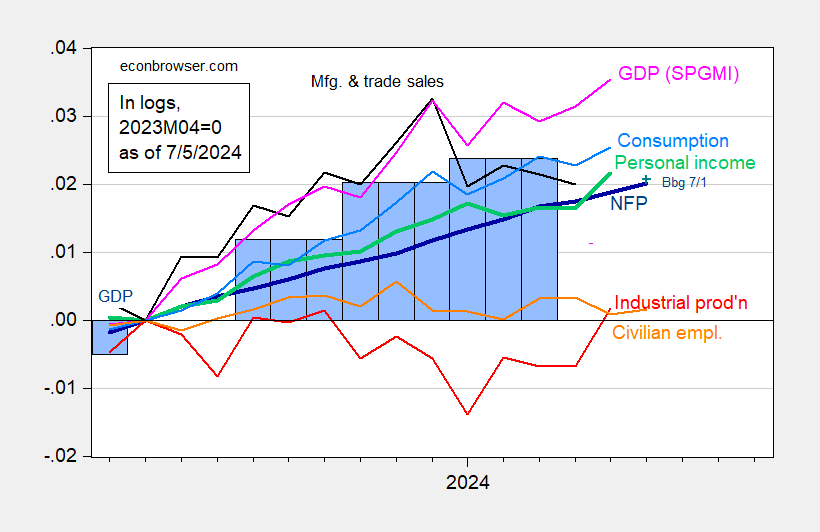
Figure 1: Nonfarm Payroll (NFP) employment from CES (bold blue), civilian employment (orange), industrial production (red), personal income excluding current transfers in Ch.2017$ (bold green), manufacturing and trade sales in Ch.2017$ (black), consumption in Ch.2017$ (light blue), and monthly GDP in Ch.2017$ (pink), GDP (blue bars), all log normalized to 2023M04=0. Source: BLS via FRED, Federal Reserve, BEA 2024Q1 third release, S&P Global Market Insights (nee Macroeconomic Advisers, IHS Markit) (7/1/2024 release), and author’s calculations.
There are questions whether the CES is overstating employment growth, perhaps because of the birth-death model. Here is cumulative growth private NFP since March 2023 (last benchmarked data), compared against ADP’s series (which does not rely upon the birth-death model).
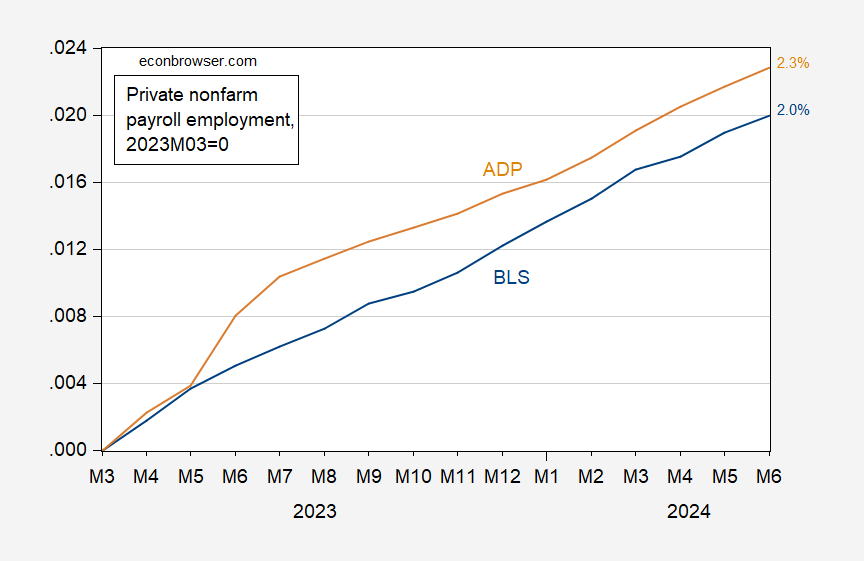
Figure 2: Private nonfarm payroll employment from BLS (blue), and from ADP (tan), in logs 2023M03=0. Source: BLS, ADP via FRED, and author’s calculations.
Here’s the three month (nonannualized) growth rate of these two series.
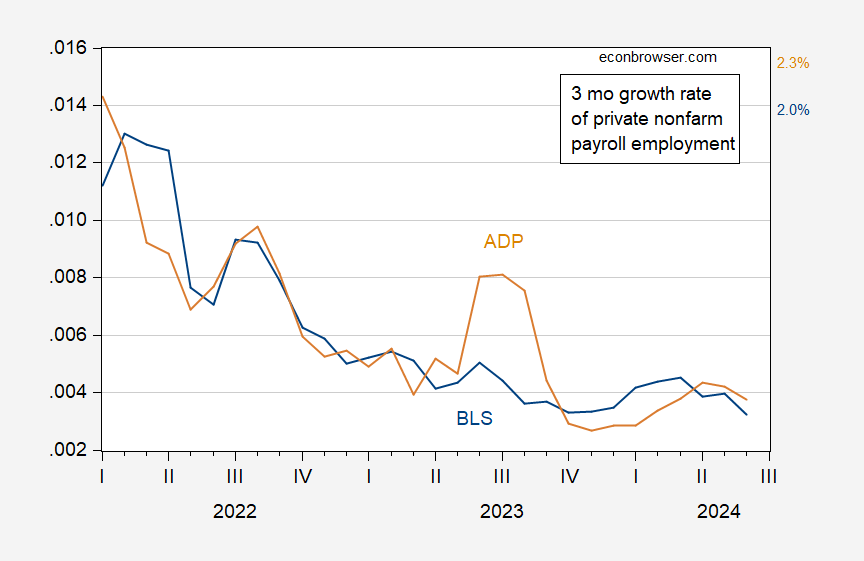
Figure 3: Three month growth rate of private nonfarm payroll employment from BLS (blue), and from ADP (tan), calculated as log differences. Source: BLS, ADP via FRED, and author’s calculations.
Average hourly earnings up 0.3% following a 0.4% rise in May. A soft start to Q2 keeps the quarterly average cooling, but still reasonably strong. Looks like the September-January soft patch for wages is over:
https://fred.stlouisfed.org/graph/?g=1pO4O
Starmer has named Rachel Reeves as Chancellor of the Exchequer. She’s the first woman to hold that job. Her elevation to the position is no surprise. From Wikipedia:
“Joining the Labour Party as a teenager, Reeves studied at New College, Oxford, and the London School of Economics before working at the Bank of England and then HBOS. Elected at the 2010 general election, she served in Ed Miliband’s Shadow Cabinet as Shadow Chief Secretary to the Treasury from 2011 to 2013 and Shadow Secretary of State for Work and Pensions from 2013 to 2015. Reeves became a backbencher following Jeremy Corbyn’s election as Labour leader in 2015 and served as chair of the Business, Energy and Industrial Strategy Committee from 2017 to 2020.
“After Starmer was elected as (Labour Party) leader in 2020 he appointed her Shadow Chancellor of the Duchy of Lancaster and Shadow Minister for the Cabinet Office, shadowing Michael Gove. In May 2021 Reeves replaced Anneliese Dodds as Shadow Chancellor of the Exchequer. In this role she has adhered to “modern supply-side economics”, an economic policy that focuses on infrastructure, education and labour supply by rejecting tax cuts and deregulation. It is heavily inspired by Joe Biden’s economic policy, particularly his Inflation Reduction Act.”
So she has the education and experience to do the job. It’s a big one.
The U3 rate, the quits rate and wages vary together:
https://fred.stlouisfed.org/graph/?g=1pOit
The odd behavior of average hourly earnings around the Covid recession is due to changes in the composition of employment – more low-wage than high-wage workers lost and then regained employment. Don’t let that confuse you.
Looking at time-series data over a brief period can lead to bad conclusions, but I’m gonna do it anyway:
https://fred.stlouisfed.org/graph/?g=1pOje
While the jobless rate is still climbing, it looks like both the quits rate and average hourly earnings gains have stabilized over the past few months. Neither is as frisky as it was earlier in the expansion, but both are relatively strong compare to the average of recent decades. That’s a sign of health.
https://fred.stlouisfed.org/graph/?g=1pOje
One way to read the recent stability of the quits rate and wage gains despite a rising jobless rate is that the jobless rate at 4.1% still reflects labor scarcity. Another is that the U3 rise represents distortions in unemployment measures. The two explanations are not mutually exclusive; both could be true.
Not only that, but in fact the quits rate tends to lead YoY wage gains.
A forecasting colleague noted that in June the number of permanent job losers went down, while job leavers went up.
I haven’t looked extensively today, but it does appear that the YoY% gains in both new entrants and re-entrants averaged quarterly is at near record levels, save for coming out of recessions. Again, this is evidence for the theory that at least much of the increase in the unemployment rate is coming from labor force supply rather than demand weakness.
You should be able to test your guess against the data. What’s the point og guessing if you don’t do the work to find out whether you’re right?