CPS based series adjusted to NFP way below official NFP, early benchmark.
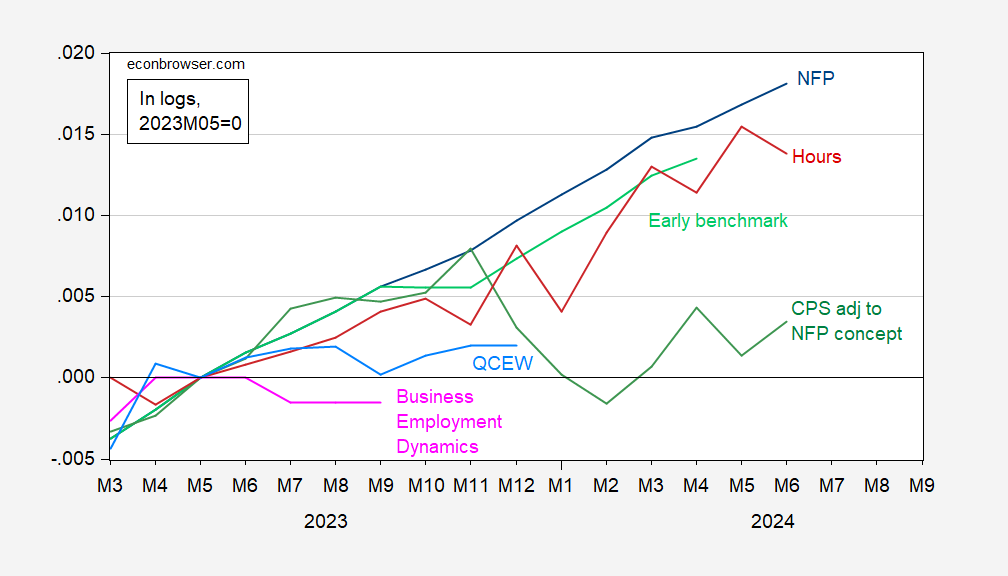
Figure 1: Nonfarm payroll employment from CES (blue), CES hours (red), QCEW adjusted by geometric moving average by author (light blue), Business Employment Dynamics (pink), and Philadelphia Fed early benchmark (light green), all in logs, 2023M05=0. BED series normalized to 2019Q4 NFP level. Philadelphia Fed series is official CES adjusted by ratio of early benchmark sum of states to CES sum of states ratio. Source: BLS via FRED, BLS, QCEW/BLS, BED/BLS, Philadelphia Fed and author’s calculations.
Given how far QCEW and BED series are below CES based NFP, one can justifiably wonder if the official NFP is severely overcounting employment (I wouldn’t place too much weight on the CPS series adjusted to NFP concept, given the uncertainty about the reliability of population controls used to construct civilian employment). As noted before, however, the fact the private NFP is growing less rapidly than the ADP measure (which is not susceptible to criticisms regarding the firm birth/death model) gives me some measure of confidence.
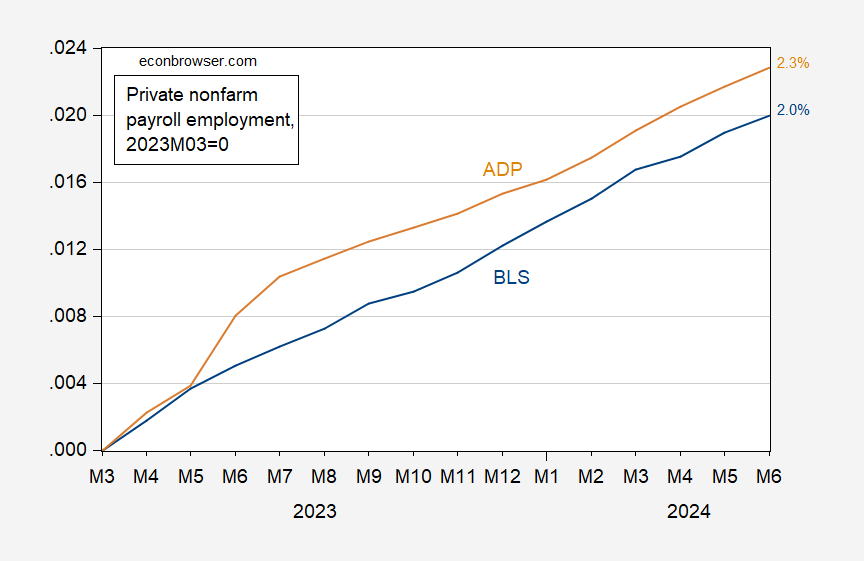
Figure 2: Private nonfarm payroll employment from BLS (blue), and from ADP (tan), in logs 2023M03=0. Numbers on right are cumulative increases since 2023M03, in logs. Source: BLS, ADP via FRED, and author’s calculations.
Mark Redding: Wow. See this post. Check out the company you’re in.
Do you always suspect “funky stuff” when you see data you don’t like?
The scientific response to a set of data you don’t understand, is to look into the details. A good scientist does that with an open mind to the possibilities of being wrong/ignorant, or the data not representing what it is understood to represent.
The fact that you offer this idea without knowing where it comes from or what has been written pro and con about it, is par for the course. Seriously, read something.