Are you better off than you were 4 years ago?
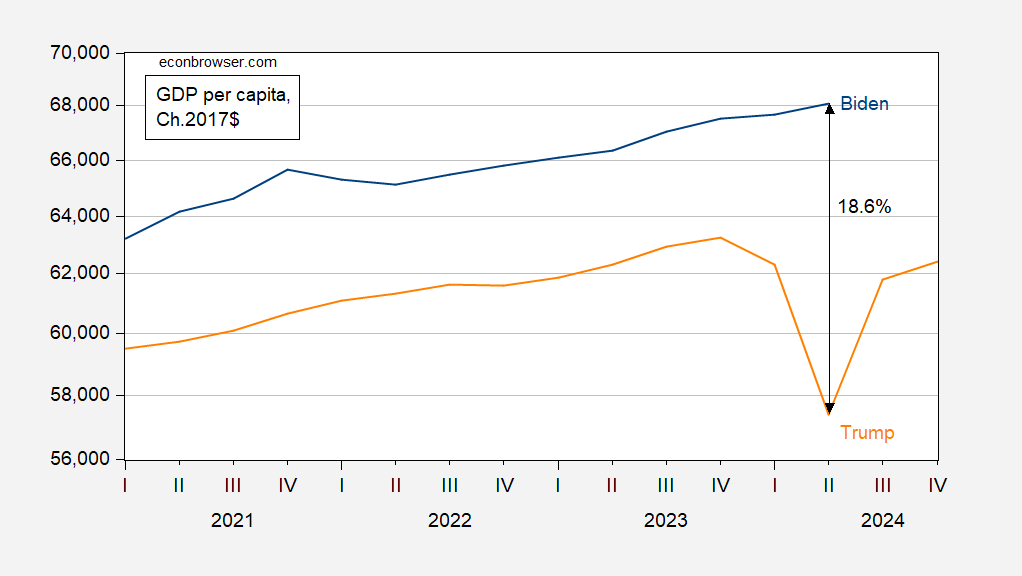
Figure 1: GDP per capita (blue), lagged 4 years (orange), in 2017$, SAAR. Source: BEA via FRED.
Yes, by 18.6% in output terms. What about cumulative change from beginning of administration?
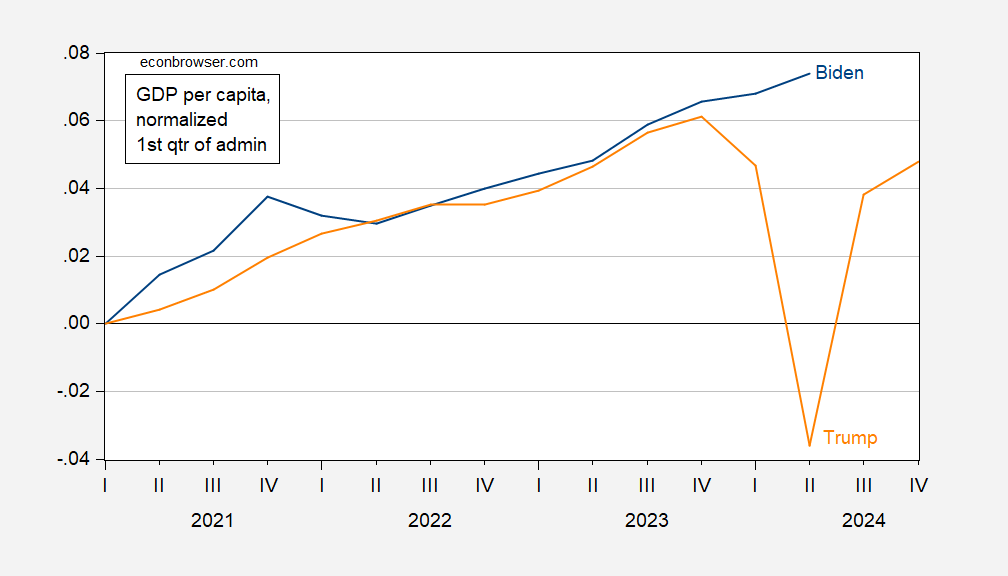
Figure 2: Log GDP per capita since 2021Q1 (blue), since 2017Q1 (orange), in 2017$, SAAR. Source: BEA via FRED.
Note that even when comparing per capita income just before the pandemic to 2023Q4 output, it’s looking better under Biden.
“Yes, by 18.6% in output terms.”
Well yea but …
The Faux News/Bruce Hall types will go “but prices have gone up by around 20%”. Well yea but Dr. Chinn was not describing nominal GDP. Nominal GDP grew by almost 40% so real income grew by this 18.6%. Sometime MAGA morons fail to get.
@ pgl Respectfully, the Bruce Hall types will go “yeah, but Covid-19”. You know, the virus that killed people with weak lungs and weak immune systems that all Republicans and “conservatives” “imagined” had died. In their own family.
Reality is perception….
https://www.statista.com/statistics/203961/wealth-distribution-for-the-us/
WTF Bruce? A link that does not work and a comment that says nothing. I guess you are losing it even more than Trump has!
OK – the link finally opened. Slow of Bruce Hall’s little brain I guess. Title:
Wealth distribution in the United States in the fourth quarter of 2023
Gee – wealth is heavily distributed towards the rich. Take a bow Brucie – the rightwing policies of your heroes are having their intended effect. MAGA.
This is so sad. Brucey can’t bring himself to make a point in simple English. He been wrong too often to risk it. He spouts this gnomic nonsense instead.
A few questions: If reality is perception, does that mean the sun revolves around the earth? If I see a mirage of a Hotel 6, can I get a room there? Is J.D. Vance really as dumb as he seems?
By the way, Brucey apparently meant to link to something like this:
https://www.federalreserve.gov/releases/z1/dataviz/dfa/distribute/chart/
Maybe he’ll explain why.
First of all – your graph shows wealth over time as opposed to a worthless snapshot of wealth in a particular quarter. Hey Brucie – pay attention (dumba$$).
Secondly, it gives a different picture than Brucie boy’s worthless snapshot did. I’ll leave it to others to comment on credibility of the two sources (this one is just too easy).
But it would be grand if this excellent chart of nominal wealth could be translated into inflation adjusted terms. Not that a MAGA moron like Bruce Hall would know how to do that.
Is J.D. Vance really as dumb as he seems?
Oh that one is easy. He is dumber – much dumber. Yes – he is almost as dumb as Bruce Hall.
I’ve been comparing wealth as of 2024QI to as of 2020QIV – the Biden years which Brucie is supposed to be telling us was terrible for the bottom 50%. I’ll give the nominal increases in a moment but for inflation adjustment considerations, the PCE measure of consumer prices rose by 16.2% (hey Brucie – I know Kelly Anne told you this was 40% but she lies all the time).
Total wealth rose by 22.4% so aggregate real wealth rose by around 6%. Not too bad.
The struggling bottom half? Nominal increase = 38.5%. So real wealth while not high on a per capita basis rose a lot in percentage terms. And its share of aggregate wealth rose.
Damn Bruce – when presented with actual FACTS, the trash Kelly Anne ask you to feed us crumbles.
https://www.msn.com/en-us/news/politics/trump-attack-on-harris-s-race-frustrates-and-panics-republicans/ar-BB1r1K7B?ocid=msedgdhp&pc=U531&cvid=53e40337cb13403cbd6e5435c5f2ca3e&ei=5
A few Republicans criticized Trump for his birtherism 2.0 yesterday but a lot just ducked like the cowards they are. One thing they all have in common – the head of their party is a disgusting flaming racist. MAGA?!
The one high caste Hindu I know is a wonderful person. PhD very successful.
Hey moron – SHUT UP. BTW – look up the word biracial you effing racist.
Kamala refuses to be defined by Trumps weird obsessions with things that has no influence on regular peoples life.
Two things about the Trump meltdown yesterday. First up – Laura Loomer hyping Trump’s birtherism 2.0:
https://loomered.com/2024/08/01/exclusive-kamala-harris-birth-certificate-states-she-is-not-black/
Did you see when Trump took the reporter’s water bottled and tightened the lid. I guess Big Man Donald dominated her. Such a pathetic little man.
Just weird and pathetic. Does he really think he can intimidate someone by tightening the lid on their water bottle? Even the idea of touching someone else’s water bottle is very weird. Is senility finally getting the best of him – he is the oldest person ever to be nominated by his party.
a bit of a tangent…
this morning’s construction spending report shows nominal spending for all three months of the second quarter was much higher than what was reported by the BEA in the advance report for 2nd quarter GDP last week.…the annual rate of construction spending for April was revised roughly $21.1 billion higher, from $2,142.1 billion to $2,163.2 billion, and annualized construction spending for May was revised $15.0 billion higher, from $2,139.8 billion to $2,154.8 billion….in reporting 2nd quarter GDP, the Excel file with key source data and assumptions accompanying the report indicated on line 86 that they had estimated that the value of June’s nonresidential construction would be $2.2 billion less than that of the previously reported May figure, that June’s residential construction on line 117 would be $6.7 billion less than that of the previously reported May figure, and that the value of June’s public construction shown on line 201 would be $0.5 billion less than the previously published May figure…hence, the total of the figures used by the BEA for total June construction in the 2nd quarter GDP report were $9.4 billion less than the previously published May figure…with June construction now reported down $6.4 billion from a May figure that was revised $15.0 billion higher, that means that the BEA had underestimated annualized June construction spending by $18.0 billion when reporting 2nd quarter GDP…thus, after averaging the revisions to construction spending for the three months of the 2nd quarter, we find the total revised annualized figure for 2nd quarter construction spending would thus be $18.03 billion more in current dollars than the figures used by the BEA when computing 2nd quarter GDP….that implies we’ll see an upward revision of about 0.22 percentage points to the construction components of 2nd quarter GDP when the 2nd estimate is released on the 29th of August, give or take depending on the mix of inflation adjustments to the revised figures…
however, we might give all that back and more when the annual revision is released with the 3rd estimate of 2nd quarter GDP on September 26th…the May construction spending report included an annual revision wherein unadjusted construction spending data was revised back to January 2023, and seasonally adjusted data was revised back to January 2017; that revision revised April spending 2.1% higher, and March spending 1.6% higher, and earlier months similarly higher as well…when computing 2nd quarter GDP, the BEA used the revised 2nd quarter construction figures for the second quarter, but kept the first quarter construction figures as they were originally published…the annual revision will correct that…
Nicely done.
I notice that, apart from commercial, non-residential lodging and multi-family residential construction, every big category is up from a year ago. Multi-family residential is probably an over-building problem in the fastest-growing “smile” states. Nashville has too few homes overall, but too many new rental units. If memory serves, Birmingham and Atlanta have the same problem. We know too well why commercial construction is down.
I was unaware of a hotel glut, perhaps because there isn’t one. Reuters offers a potential explanation for a building slowdown amid a hotel shortage:
https://www.reuters.com/business/hotel-executives-set-sights-empty-office-buildings-supply-lags-demand-2024-06-05/
Discouraged by high interest rates from much new construction, hotel chains are looking at empty offices in prime locations to convert to hotels. From resource-use and public revenue perspectives, this looks like a great idea.