Last week we got GDP and wages and salaries for Q1, as well as employment and coincident indicators for May. With these data, we have the following picture.
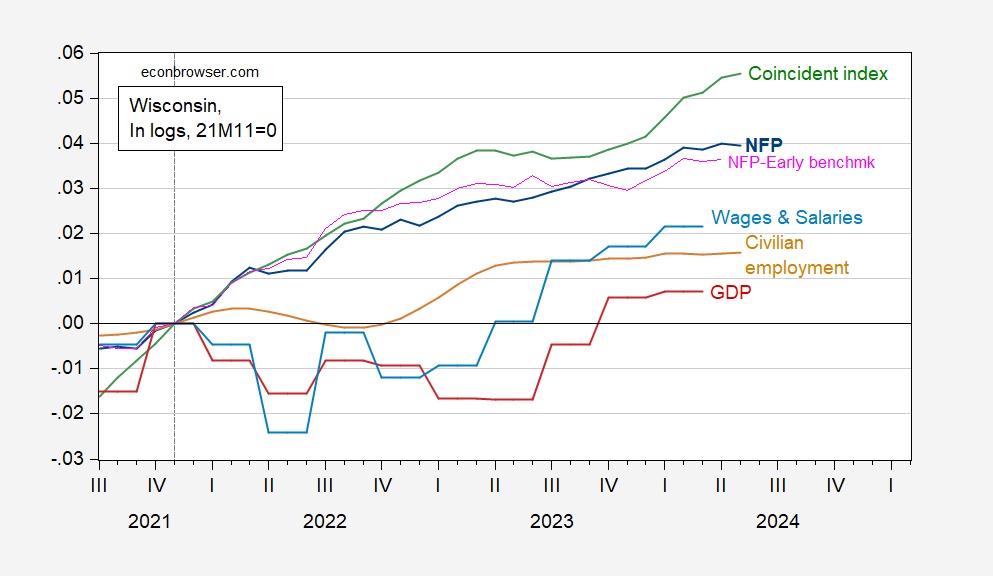
Figure 1: Wisconsin Nonfarm Payroll Employment (dark blue), Philadelphia Fed early benchmark measure of NFP (pink), Civilian Employment (tan), real wages and salaries deflated by national chained CPI (sky blue), GDP (red), coincident index (green), all in logs 2021M11=0. Source: BLS, BEA, Philadelphia Fed [1], [2], and author’s calculations.
GDP shows a flattening trend through 2024Q1. However, most other indicators show continued growth in Q1 and thereafter. In particular, wages and salaries (currently about 52% of total income, and 46% of GDP) deflated by chained CPI continued to grow.
Both employment measures (CES, CPS based) have been flat since January/February of this year, suggesting a plateauing of employment. On the other hand, the coincident index — based upon additional labor market data — shows continued rise.
In sum, we have continued mixed indications, with growth or sideways trending.