With the Fed’s industrial production release (-0.6% m/m vs. -0.3% consensus) and retail sales (+1.0% m/m vs. +0.4% consensus), we have the following pictures, the first of the indicators followed by the NBER Business Cycle Dating Committee, plus monthly GDP.
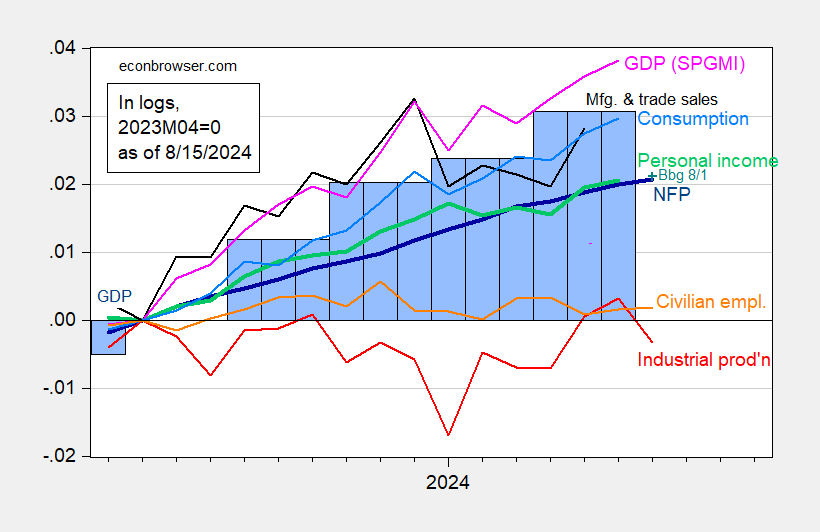
Figure 1: Nonfarm Payroll (NFP) employment from CES (bold blue), civilian employment (orange), industrial production (red), personal income excluding current transfers in Ch.2017$ (bold green), manufacturing and trade sales in Ch.2017$ (black), consumption in Ch.2017$ (light blue), and monthly GDP in Ch.2017$ (pink), GDP (blue bars), all log normalized to 2023M04=0. Source: BLS via FRED, Federal Reserve, BEA 2024Q2 advance release, S&P Global Market Insights (nee Macroeconomic Advisers, IHS Markit) (8/1/2024 release), and author’s calculations.
Industrial production sagged more than anticipated. The same is true for manufacturing production. In Figure 2, I show a series of alternative indicators, including manufacturing production, retail sales, and alternative civilian employment, as well as GDO.
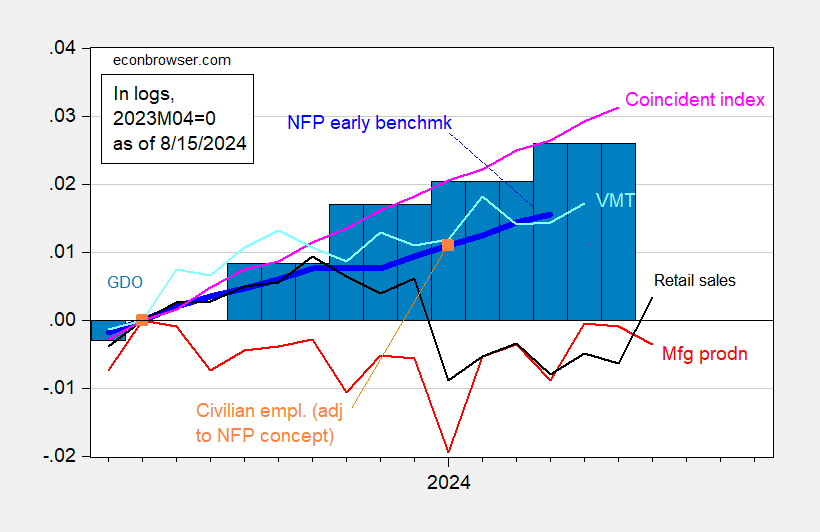
Figure 2: Nonfarm Payroll (NFP) employment Philadelphia Fed early benchmark (bold dark blue), civilian employment adjusted using population estimates of Edelberg and Watson (see text) (orange square), industrial production (red), personal income excluding current transfers in Ch.2017$ (bold green), manufacturing and trade sales in Ch.2017$ (black), consumption in Ch.2017$ (light blue), and Coincident Index (light pink), GDO (blue bars), all log normalized to 2023M04=0. GDI used in calculating GDO for 2024Q2 estimated by predicting 2024Q2 net operating surplus using GDP, lagged surplus, lagged differenced surplus, 2021Q1-2024Q1.Source: BLS via FRED, Federal Reserve, BEA 2024Q2 advance release, Philadelphia Fed, Edelberg and Watson (2024) population data provided in personal communication, and author’s calculations.
I applied labor force participation rates for native and foreign born populations to alternative estimates of population from Edelberg and Watson (2024). As they write in their report:
In our previous work, we provided evidence that CPS data underestimated the recent increase in the civilian non-institutionalized population of people in the United States ages 16 and up (hereafter referred to as the population). That piece presented estimates of aggregate population numbers and employment growth that were larger than published CPS data.
I then apply the reported unemployment rates for native and foreign born populations to the alternative labor force calculations to generate employment levels for each category. Summing the two provides an alternative employment level, which I then rescale to match 2021M01 levels (which predates the pandemic). In order to estimate a 2023M04 level (used to normalize), I do a geometric interpolation of 2023M01 and 2024M01 alternative levels.
GDPNow for Q3 as of today is 2.4%. The Lewis-Mertens-Stock NY Fed WEI reads 2.29% for data released through 8/10/2024.
Here’s a story Macroduck might appreciate:
Trump Argues Migrants are Stealing Jobs, Experts and Data Disagree
https://www.msn.com/en-us/news/politics/trump-argues-migrants-are-stealing-jobs-experts-and-data-disagree/ar-AA1oS4zJ?ocid=msedgdhp&pc=U531&cvid=39de21e70d6e49e2a6a9f54892288f4b&ei=9
Stealing my work! That’s what these “experts” are doing, I tell ya!
Rodney Dangerfield would tell ya:
“Data is pulling your leggy, it’s all schmegegge.”
Here’s hoping the daughter of a couple of migrants “steals” HIS job!
Kamala Harris worked for McDonald’s to put herself through school. Donald Trump may be the best customer of McDonald’s.
Now I bet she had to make a lot of Big Macs but likely not at many as Donald Trump has consumed.
Mixed signals. Maybe no recession but it would be prudent to lower interest rates.
Retail sales up:
Advance Monthly Sales for Retail and Food Services
August 15, 2024
https://www.census.gov/retail/sales.html
Probably old news (remember this poor boy don’t have him no cable, er paid streamin’) but thought I would share for anyone, similar to me, a little behind the curve on the news:
https://www.cnbc.com/2024/08/12/harris-economic-policy-plan-trump-election.html
Neutral on these personnel choices for the moment.
Brian Deese has spent a lot of time on climate change economics. Of course we know Team Trump is more the drill, baby, drill as a solution for all of our issues including the high cost bacon and housing costs.
“I then apply the reported unemployment rates for native and foreign born populations to the alternative labor force calculations to generate employment levels for each category. Summing the two …”
Go ahead- make the rest of us look lazy.
JD Vance blames higher crime rates on ‘wave of Irish immigration’ in resurfaced clip
https://www.irishstar.com/news/us-news/jd-vance-blames-higher-crime-33474033
Whoa – my great grandparents moved from Ireland. And as I understand it – so did Vance’s. OK, Vance may be a criminal but not me.
In his book, Vance talks several times about the problems of Appalachia being caused to some extent by the “bad genes” of the Scots-Irish immigrants. One wonders how close to eugenics he veers in his private thoughts. It would be irresponsible not to speculate! (h/t Peggy Noonan.)
I wish I could find a link to David Brooks’ first column on JD Vance. June 2016 NYT. I would copy/paste the entire thing here if I could. I bet it has some hilarious howlers on how bad a judge of character Brooks is. The man is absolutely clueless on human nature.
Once upon a time, I posted links to data on crime rates among native-born vs immigrants. During the highest period of Irish, Italian and German immigration, the crime rate among immigrants was higher than among native born. Memory fails me, but I think that was through WWI. There was a period when native and foreign-born crime rates were roughly equal, on the way to maybe the 1970s or 1980s (?), which is when crime among native-born types becomes more likely than among immigrants.
Essentially, the browner the mix of immigrants, the less prone to crime.
Think how the data would skew if we were serious about white-collar crime.
Donald Trump’s ‘messaging event’ on the economy was a complete mess
https://www.msn.com/en-us/news/politics/donald-trump-s-messaging-event-on-the-economy-was-a-complete-mess/ar-AA1oSkgL?ocid=msedgdhp&pc=U531&cvid=4946ab5782ec4704b3901a50c686dcaa&ei=6
Me thinks Joy Reid should give Trump a pass. Yea – it was a complete mess but come on – he had Bruce Hall put this together for him so what can we expect?
Republicans/”conservatives” are a classy bunch of folks. Pious as they are. When offered food for CHILDREN so they can have enough nutrition for their still growing bodies and still growing minds, and food which gives them enough energy to perform during the regular school year and not to literally starve in the summer months Republicans say “NO, feeding children is a ‘waste’ “. I hope someday Republicans meet their God, and can explain to him how starving elementary school children was the “Christian” thing to do.
https://kfor.com/news/stitt-declines-to-participate-in-federal-childrens-summer-lunch-program-for-second-year/
Matthew 18:10
“Take heed that you do not despise one of these little ones, for I say to you that in heaven their angels always see the face of My Father who is in heaven.
Matthew 18:2–6
Then Jesus called a little child to Him, set him in the midst of them, and said, “Assuredly, I say to you, unless you are converted and become as little children, you will by no means enter the kingdom of heaven. Therefore whoever humbles himself as this little child is the greatest in the kingdom of heaven. Whoever receives one little child like this in My name receives Me. “But whoever causes one of these little ones who believe in Me to sin, it would be better for him if a millstone were hung around his neck, and he were drowned in the depth of the sea.”
Ask yourselves, what child would deny another child food if they had it in their possession and weren’t hungry themselves?? What child would do that?? But Republicans “know better” than Jesus did. What a great lot they are. Take a bow Republicans. Terrific morals. Take a bow.
applying appropriate prices indexes from the CPI to retail sales, i get real retail sales up 1.3% (vs +0.8% from FRED)
while that looks like a rocket start to Q3 GDP, i’d caution that retail sales of autos & parts were up 3.6% in July after falling 3.4% in June…that was because of the June hack of the auto dealer’s software, which made it impossible for them to close sales in June…..so your June auto production went into inventories, and obviously came out of inventories with July sales…net, it should be close to a wash…
also note that the Fed reported a 7.8% drop in the seasonally adjusted industrial production index for motor vehicles and parts in July. that was down because vehicle manufacturers had been cancelling their normal July retooling shutdowns in prior years due to supply chain issues, skewing the seasonal adjustment…there was approximately a 8% decrease in the upward seasonal adjustment to July this year compared to last:
https://www.federalreserve.gov/releases/G17/mvsf.htm
note the 23 point difference in the adjustment factor from July to August…last year it was over 30…
finally, who believes that utility output fell 3.7% in July? (as per the industrial production report) southern parts of the country have been pulling natural gas out of storage instead of injecting it due to the heat…seasonally adjusted or not, i can’t see that 3.7% drop, so i expect a big revision next month…