The recovery continues, with a recession hard to see (even incorporating the preliminary benchmark revision without caveat). A snapshot of indicators followed by the NBER’s Business Cycle Dating Committee, plus monthly GDP.
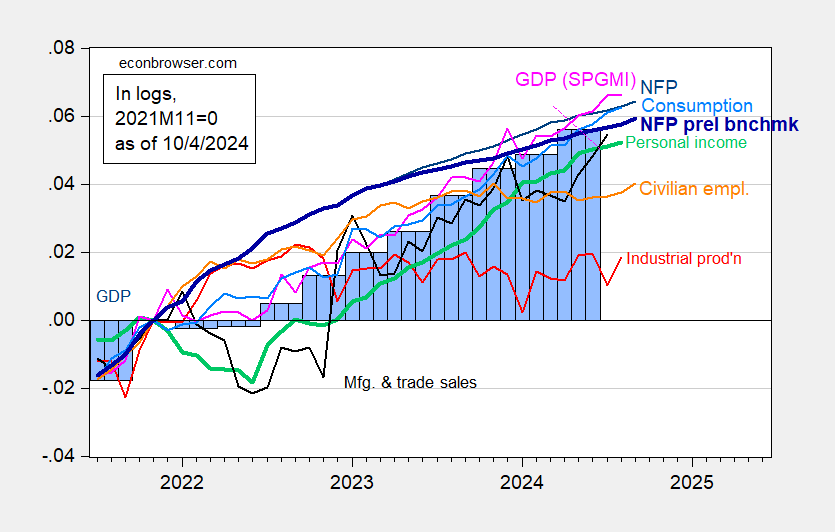
Figure 1: Nonfarm Payroll (NFP) employment from CES (blue), implied NFP from preliminary benchmark (bold blue), civilian employment (orange), industrial production (red), personal income excluding current transfers in Ch.2017$ (bold light green), manufacturing and trade sales in Ch.2017$ (black), consumption in Ch.2017$ (light blue), and monthly GDP in Ch.2017$ (pink), GDP (blue bars), all log normalized to 2021M11=0. Source: BLS via FRED, Federal Reserve, BEA 2024Q2 3rd release/annual update, S&P Global Market Insights (nee Macroeconomic Advisers, IHS Markit) (10/1/2024 release), and author’s calculations.
If you were wondering what other indicators of total nonfarm payroll employment looks like, here’s a comparison.
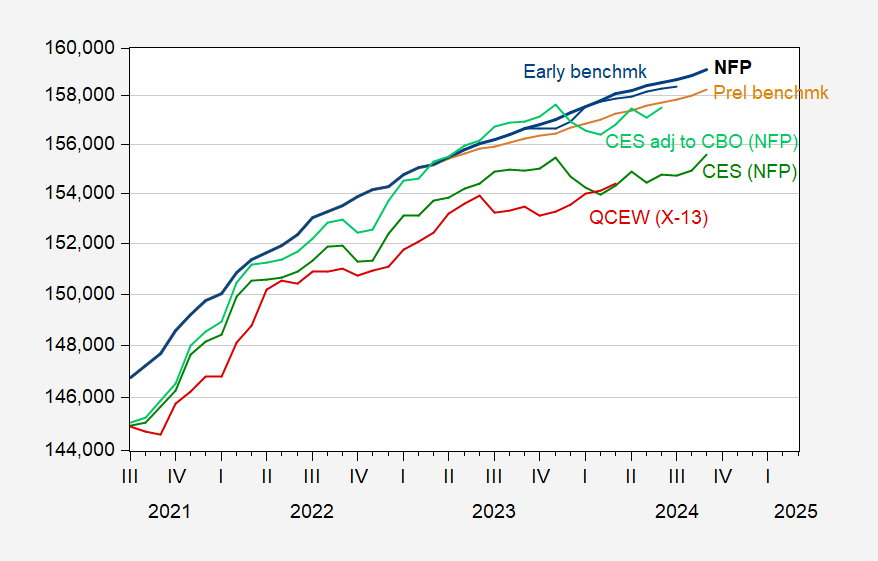
Figure 2: Nonfarm payroll employment (bold black), preliminary benchmark (tan), early benchmark (blue), household employment series adjusted to NFP concept (green), household employment series adjusted to NFP concept, adjusted to incorporate CBO population estimates through mid-2024 (light green), and QCEW total employment seasonally adjusted by author using X-13 (red). Early benchmark adjusts reported NFP by ratio of sum-of-states early benchmark to sum-of-states as reported by CES. Source: BLS, BLS via FRED, Philadelphia Fed, and author’s calculations.
There’s a big gap between NFP and the household series adjusted to the NFP concept. Part of that could be attributed to the fact that establishment NFP counts jobs, while household concept NFP counts people. However, he bigger difference is likely due to the use of population controls that undercount total population. Adjusting by CBO’s estimates of the BLS/Census undercount, one gets a series close to the establishment NFP (see light green line) through June 2024.
With these data preliminary September data, it’s hard to argue a recession has arrived.
But labor force participation rate is still below pre-pandemic levels per MAGA moron and fake PhD EJ Antoni!
Oh wait Antoni did not notice this series for the 25-54 year olds is above where it was under his boss Trump. I guess the Heritage Foundation never heard of demographics!
Two more dishonest EJ Antoni rants on this employment report:
(1) He is still pushing the Great Replacement theory; and
(2) He is spinning the canard that all of the employment increases were government jobs.
Hope someone takes the time to call out his latest lies. The man is literally out of control.
Granderson: Trump blames immigrants as if that were a policy position. It’s just racist
https://www.msn.com/en-us/news/politics/granderson-trump-blames-immigrants-as-if-that-were-a-policy-position-it-s-just-racist/ar-AA1rIyeI?ocid=msedgntp&pc=U531&cvid=827b92e673194db0b34e0477d2e1e9cf&ei=15
An interesting discussion that covers a number of things including the real reason why housing costs are so high. And no Donald – blaming the immigrants is not a policy position. Blaming immigrants is your go to racist garbage.