ZeroHedge and EJ Antoni assert yes, relying on the household series…
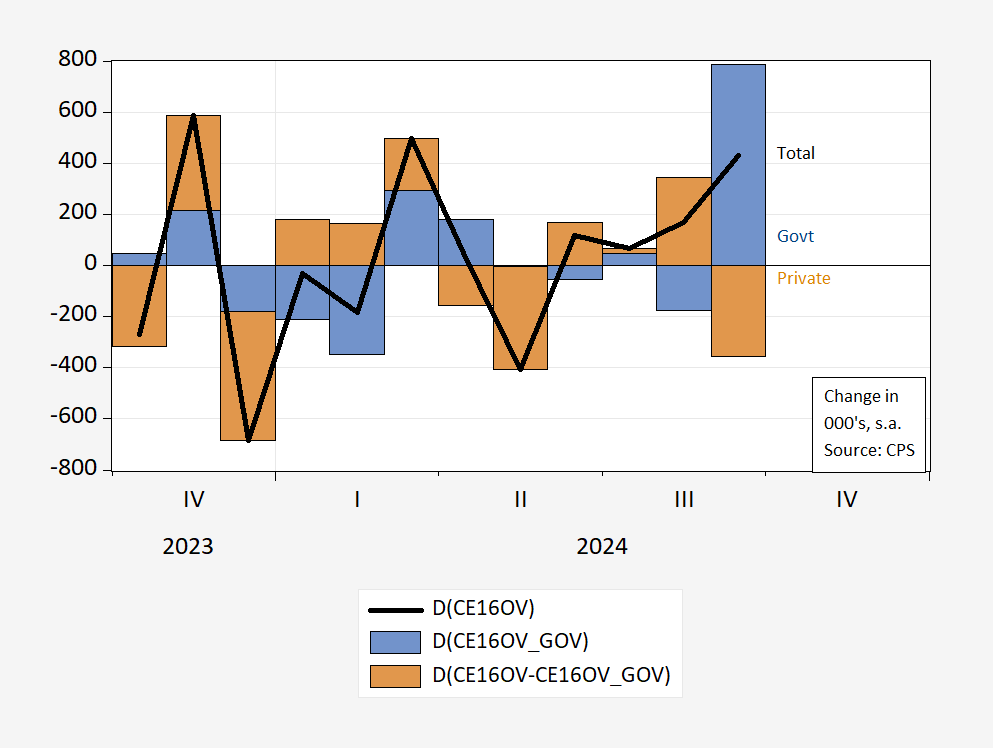
Figure 1: Total change in civilian employment (bold black), change attributable to government employment (blue bar), to private (tan bar). Source: BLS CPS, and author’s calculations.
If it seems implausible that government employment should flip-flop between positive and negative values, then you might be excused. The household survey is useful for many things, but figuring out month-to-month changes in subcategories is not necessarily one of them. For instance, compare against the corresponding graph, using the establishment survey data.
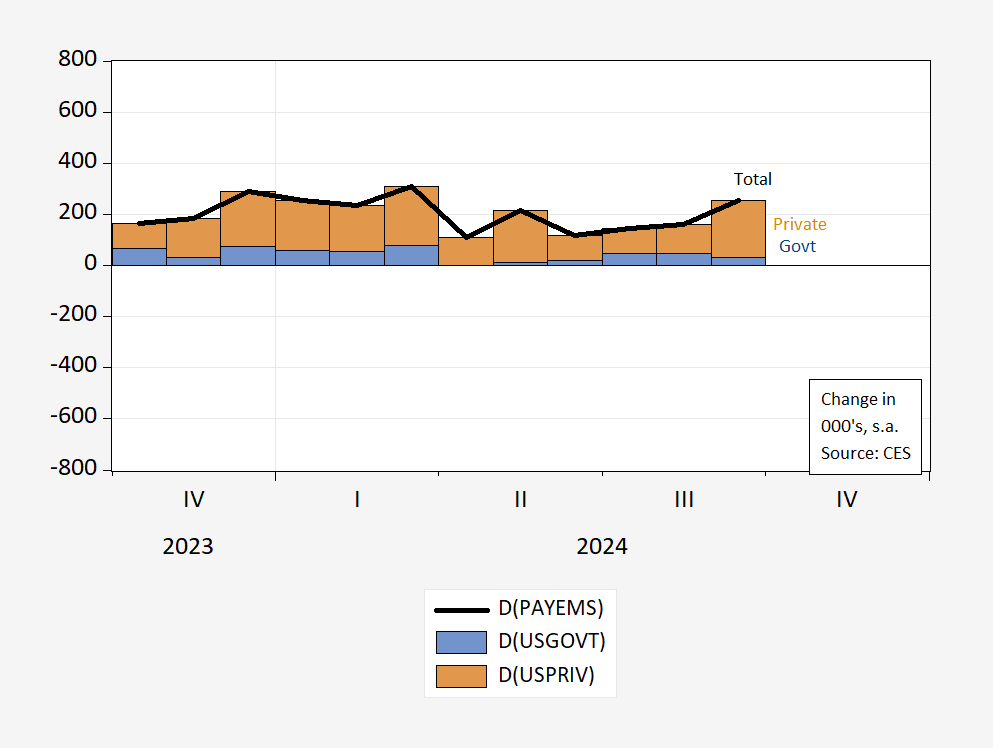
Figure 2: Total change in civilian employment (bold black), change attributable to government employment (blue bar), to private (tan bar). Source: BLS CES, and author’s calculations.
The household survey is well-acknowledged to be highly volatile, as shown in Figure 3:
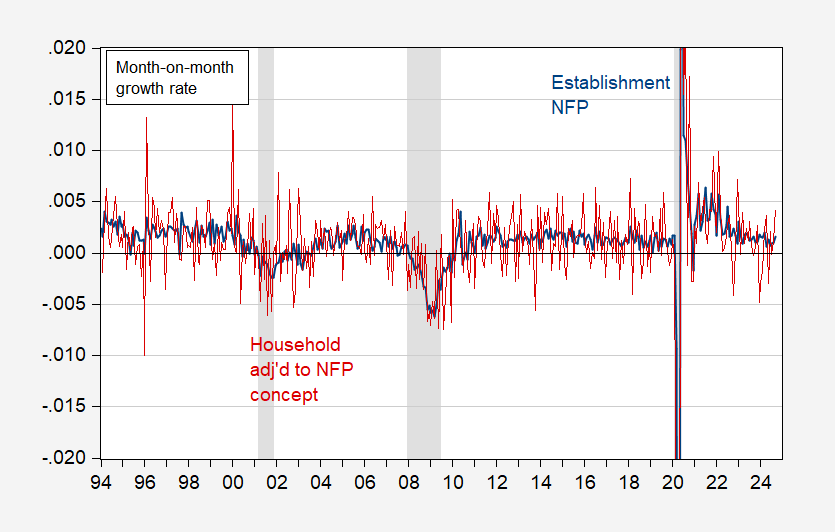
Figure 3: First log difference of CES nonfarm payroll employment (blue), of CPS employment adjusted to nonfarm payroll concept (red). NBER defined peak-to-trough recession dates shaded gray. Source: BLS, NBER, and author’s calculations.
So too for government employment (in percent terms):
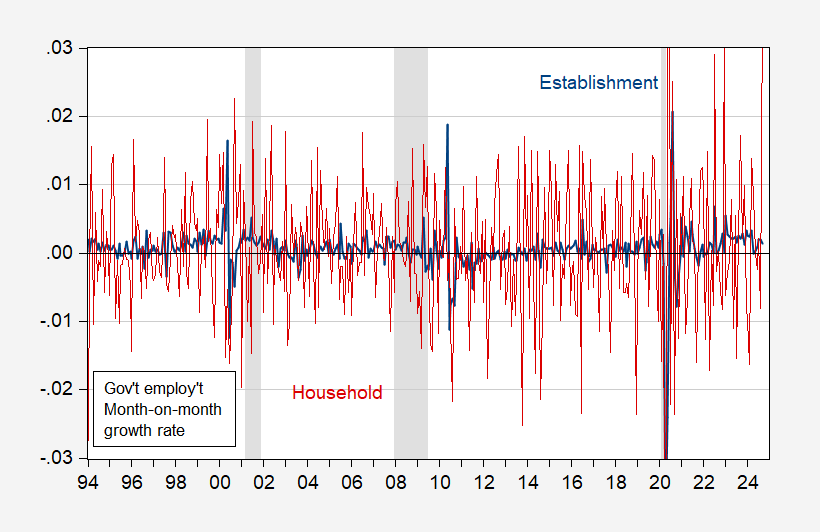
Figure 4: First log difference of CES government employment (blue), of CPS government employment (red). NBER defined peak-to-trough recession dates shaded gray. Source: BLS, NBER, and author’s calculations.
This is why ZeroHedge was forced to resort to using CPS data, and CES not-seasonally adjusted numbers. Wow.
I had hoped someone would take on Antoni’s latest lie and you delivered! Thank you!
Durden’s assertion is that BLS routinely “does something” to make the jobs report look better than it should, and that the thing the BLS “does” changes arbitrarily from month to month. In fact, BLS has a system which is consistent over time. There is no month-to-month discretion in reporting the data.
Durden is a recession cheerleader when Democrats are in power. When the data don’t confirm his politically-motivated biases, he pretends there’s something wrong gwith the data.
Durden manufactures whatever conspiracy is necessary to please his readers. He pretends the government is what the NRA and ExxonMobil and Big Tobacco and the GOP would like it to be – a source of propaganda rather than data. Government data is mostly exactly the opposite, and the better protected government operations are from private and political interests, the more honest government data are.
I won’t bother with Antoni this time. In general, same story as Durden.
Exactly. Since every data collection method has weaknesses there is always going to be something one can “attack”. The biased interpreter will make those attacks when the data show something they don’t want to hear, but be silent when the same data show something the do want to hear. What many of them completely ignores is that as long as the methods remain the same the weaknesses have little or no influence on the interpretation of changes in the parameter. It often becomes part of the fight between those who want to use data to create insights and those who want to use data to support a predetermined narrative.
Try reading the comments to Antoni’s post. These MAGA morons actually think this clown is telling the truth. I guess it is what watching Faux News is like.
I think when Neil Young wrote/sang this “old man” just means “common guy or “average guy”, but in American colloquial English, “Old man” means Dad or father. So when I listened to this Neil Young song I always thought of my father, who I had a very very difficult time “relating” to/
After the deluge, the lies: Misinformation and hoaxes about Helene cloud the recovery
https://www.msn.com/en-us/news/politics/after-the-deluge-the-lies-misinformation-and-hoaxes-about-helene-cloud-the-recovery/ar-AA1rKhjr?ocid=msedgdhp&pc=U531&cvid=20d0752aa1134c7a9af8348bf2483acc&ei=12
Check out who is spreading this misinformation.
How does this B.S. disinformation get into the public discourse? – for example, some dingbat reporter (was it a Fox News dingbat?) declares to President Biden during press conference on jobs report yesterday, “Senator Rubio says the jobs numbers are fake! How do you respond?” Biden just shakes his head – in disbelief – I would have asked the reporter – Where does Sen Rubio get his evidence that these numbers are fake? Has he spoken to the professional statisticians at BLS? Or does he get his evidence from some dingbat online right-wing trolls? Also – if we are asking questions – Why did Sen. Rubio vote against the Inflation Reduction Act to help fight inflation and invest in American energy? An act that help create the job growth we are seeing today.
Holy gosh – journalists please do your job – please step outside the daily GOP spin cycle and report on reality – we got to this point from Trump’s disastrous/corrupt response to a pandemic that was killing 4,000 people a day and 14.8% unemployment under Trump – Biden/Harris have built back better and set our economy to deal with the future.
“was it a Fox News dingbat”.
Therein is the answer to your excellent question. Personally I would ban anyone from Faux News from the White House.
All Employees, Health Care
https://fred.stlouisfed.org/series/CES6562000101#:~:text=Employees%20on%20nonfarm%20payrolls%20by%20industry
Health care employment doubled from Jan. 1990 to Jan. 2020 (prepandemic) rising from 7.34% of total employment to 10.78% of total employment. Yes – we were doing more to take care of our health which is a good thing.
Now as you note there was a temporary drop in health care workers just when we needed them the most. But from Jan. 2020 to Sept. 2024, health care employment went up on net 8.4% rising to 11.17% of total employment. Again a very good thing.
If EJ Antoni really thinks we have too many health care workers, then I submit the man has a screw loose.