This is the premise of a new paper by Peter St. Onge and EJ Antoni. I have been trying to find a deflator that can yield that the result that US GDP in 2024Q2 is 2.5% below 2019Q1 levels. Based on their discussion in their paper, as well as a video by Dr. St. Onge, I have tried calculating a consumption deflator that is based on house prices and mortgage rates, using the Big Mac price (which Dr. St. Onge lauds in his video as an alternative to official statistics or PWT data), and fast food prices (specifically, the food away from home/limited services restaurants component of the CPI).
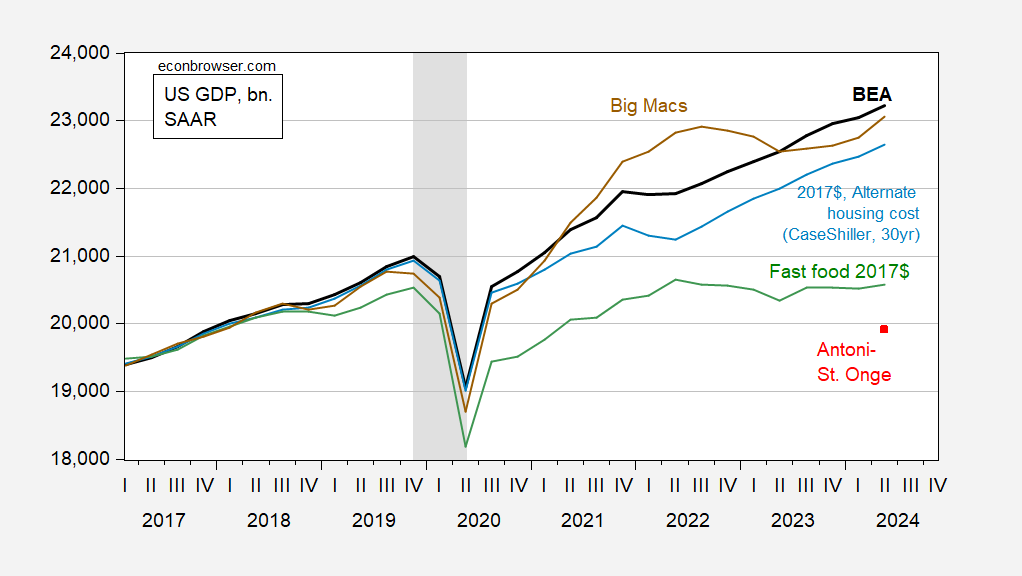
Figure 1: GDP in Ch.2017$ (bold black), using alternative consumption deflator, housing-in-PCE weights (light blue), in 2017 fast food$ (green), in 2017 Big Macs (brown), and in 2017% per Antoni-St.Onge (red square), all in billions. Big Mac prices interpolated linearly. NBER defined peak-to-trough recession dates shaded gray. Source: BEA, BLS, NBER, and author’s calculations.
Deflating by fast food prices seems to come closest to the Antoni-St. Onge estimate.
More detail on the Antoni-St. Onge paper’s methodology, and my attempts to replicate their results in this post.
“Deflating by fast food prices seems to come closest to the Antoni-St. Onge estimate.”
It turns out that the food at almost every Trump event is fast food. This explains a couple of things. How these two fake Ph.D.s have gotten so confused about what real Americans consume. And of course why Trump is as fat as Jabba the Hut.
This guy seems to write his papers very fast.
so it has become apparent that the cognitive decline of trump is accelerating. he no longer conducts interviews or other interactions with individuals. he has become too exhausted to complete the campaign trail, opting to sit out events rather than participate. he is simply too old to campaign, which means he is too old to be president. the race has really become between Harris and vance. if you listen to trump stump, it reveals an incoherent old man who has no policy or agenda other than gripes and retribution. his election goal is to remain out of jail, not run the country. trump is a convicted felon, fraud and abuser of women.
Maybe it is time for Trump to drop out and let little JD be the head of the ticket!