Three month growth rate 2.7% ann’d, 3 month diffusion index at 48.
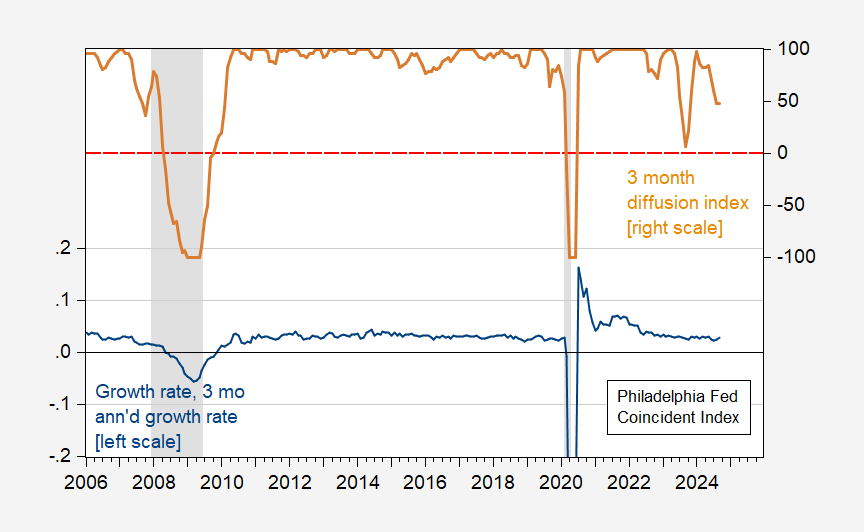
Figure 1: 3 month annualized growth rate in the Coincident Index for the US (blue, left scale), 3 month growth rate diffusion index (tan, right scale). NBER defined peak-to-trough recession dates shaded gray. Source: Federal Reserve Bank of Philadelphia, NBER, and author’s calculations.
Here’s an annotated map of the US. Red outlines are for battleground states.
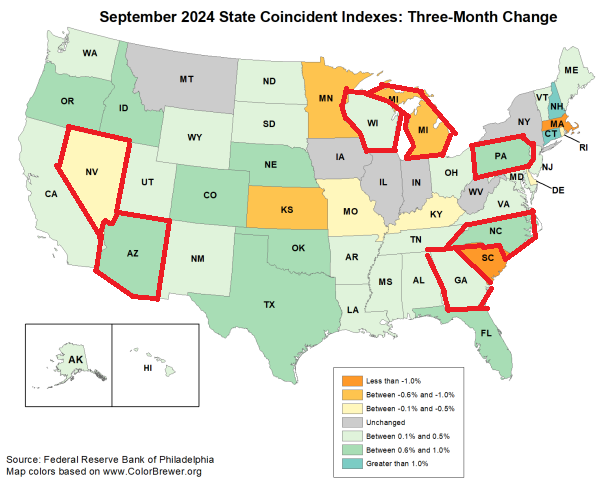
Source: Philadelphia Fed (Sept).
Sad news. Phil Lesh, bassist for Grateful Dead, dies at 84.
Jake Tapper tries to smear Kamala Harris over the fascist thing but the control room did its job:
https://www.msn.com/en-us/news/politics/humor-me-cnn-s-jake-tapper-drags-mike-johnson-and-mitch-mcconnell-in-damning-supercut/ar-AA1sWMRX?ocid=msedgdhp&pc=U531&cvid=76e3932ff2354d1bbd61c99b9c6bb18e&ei=8
Jake is not happy with his control room for its showing how Trump dishonestly called Harris a fascist and then showing it was John Kelly who came up with the FACT that Trump is a fascist.
Come on CNN – fire Tapper as he is pathetic. Whoever runs the control room should be given a huge bonus!
I guess Tapper want the control room to show the same kind of loyalty to truth and decency that Hitlers Generals did?