NBER BCDC indicators, alternative indicators, weekly indicators, nowcasts. As one who noted the high likelihood of recession by August 2024, I can’t see a downturn in the current vintages of (preliminary) data.
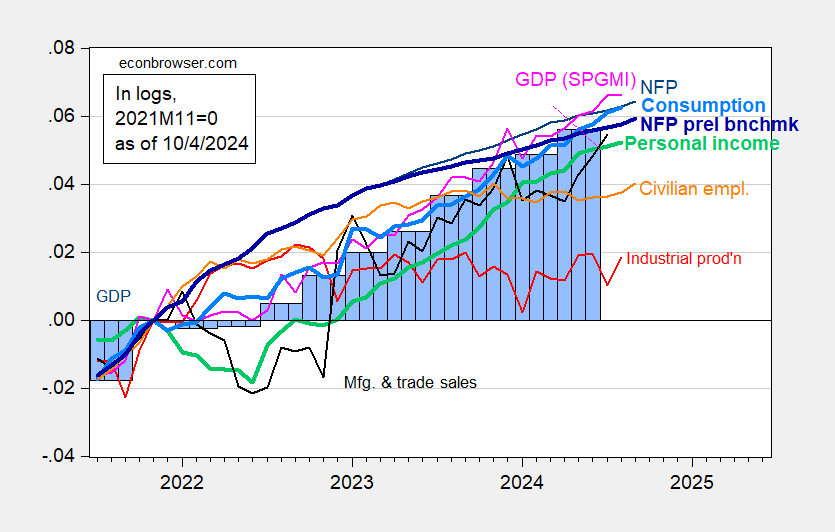
Figure 1: Nonfarm Payroll (NFP) employment from CES (blue), implied NFP from preliminary benchmark (bold blue), civilian employment (orange), industrial production (red), personal income excluding current transfers in Ch.2017$ (bold light green), manufacturing and trade sales in Ch.2017$ (black), consumption in Ch.2017$ (light blue), and monthly GDP in Ch.2017$ (pink), GDP (blue bars), all log normalized to 2021M11=0. Source: BLS via FRED, Federal Reserve, BEA 2024Q2 3rd release/annual update, S&P Global Market Insights (nee Macroeconomic Advisers, IHS Markit) (10/1/2024 release), and author’s calculations.
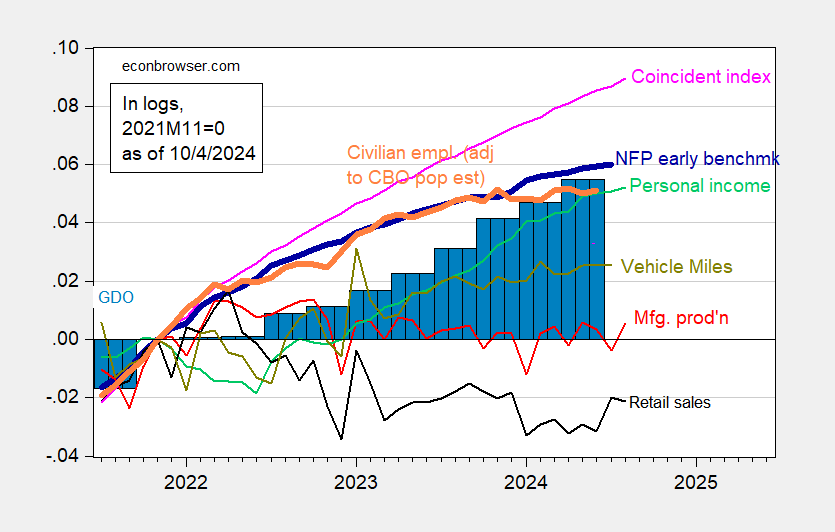
Figure 2: Nonfarm Payroll early benchmark (NFP) (bold blue), civilian employment adjusted using CBO immigration estimates through mid-2024 (orange), manufacturing production (red), personal income excluding current transfers in Ch.2017$ (light green), retail sales in 1999M12$ (black), vehicle miles travelled (chartreuse), and coincident index (pink), GDO (blue bars), all log normalized to 2021M11=0. Early benchmark is official NFP adjusted by ratio of early benchmark sum-of-states to CES sum of states. Source: Philadelphia Fed, Federal Reserve, NHTSA via FRED, BEA 2024Q2 3rd release/annual update, and author’s calculations.
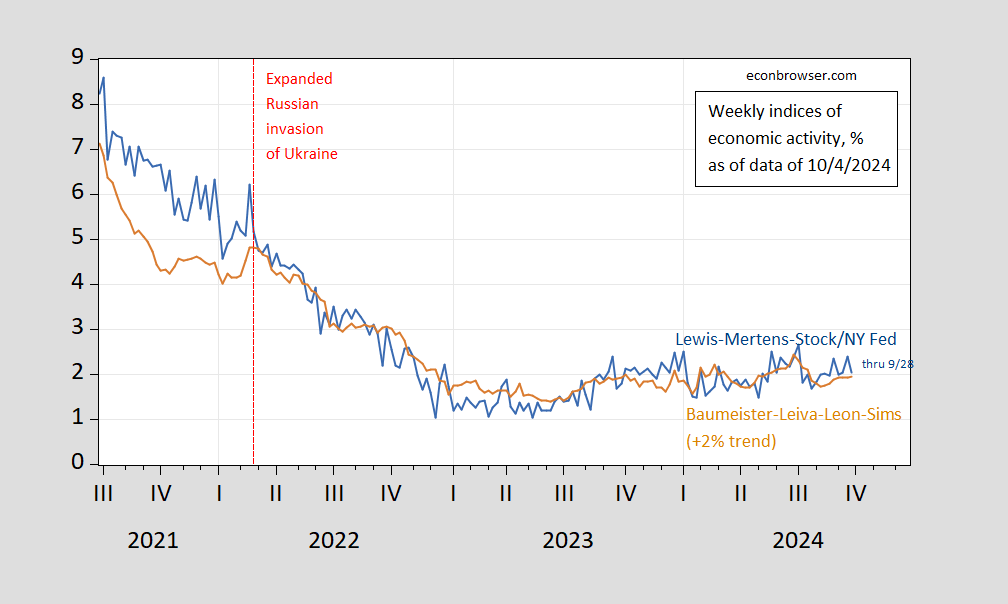
Figure 3: Lewis-Mertens-Stock Weekly Economic Index (blue), and Baumeister-Leiva-Leon-Sims Weekly Economic Conditions Index for US plus 2% trend (tan), all y/y growth rate in %. Source: NY Fed via FRED, WECI, accessed 10/6, and author’s calculations.
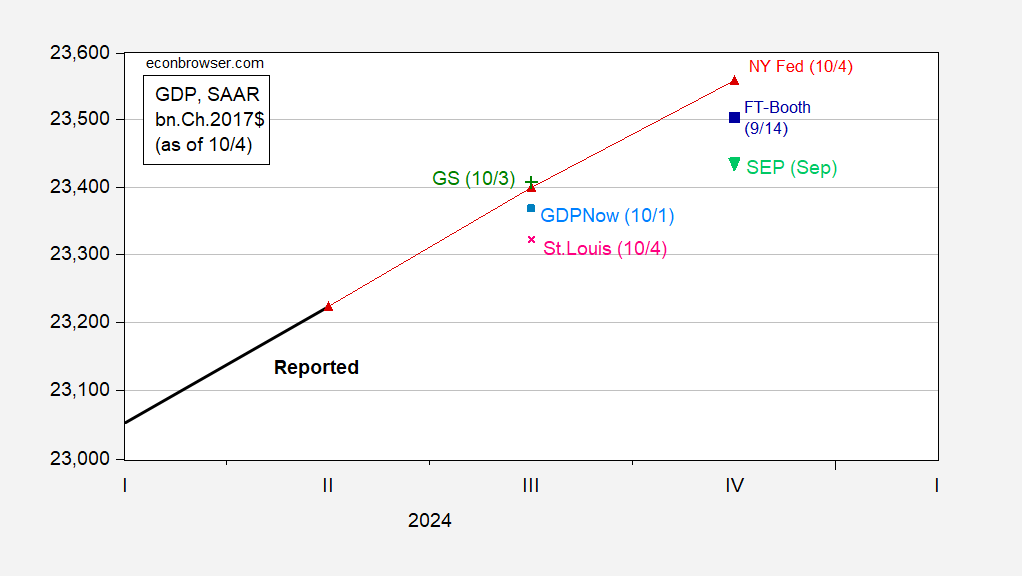
Figure 4: GDP (bold black), Summary of Economic Projections median iterated off of 3rd release (inverted light green triangle), GDPNow as of 10/1 (light blue square), NY Fed nowcast as of 9/20 (red triangles), St Louis Fed news nowcast as of 10/4 (pink x), Goldman Sachs tracking as of 10/3 (green +), FT-Booth as of 9/14 iterated off of 3rd release (blue square), all in bn.Ch.2017$ SAAR. Levels calculated by iterating growth rate on levels of GDP, except for Survey of Professional Forecasters. Source: BEA 2024Q2 2nd release, Atlanta Fed, NY Fed, Philadelphia Fed, Federal Reserve September 2024 SEP and author’s calculations.
Betting? Polymetrics places odds of a negative 2024Q3 advance release at 2% as of 4:27 CT.
Even taking NFP preliminary benchmark at face value, most indicators are rising — even alternatives (except perhaps retail sales). High frequency indicators (weekly) are near trend through data available as of 9/28. Finally, nowcasts, aside from St. Louis Fed’s, are indicating above trend (2%) growth in Q3.
For those who are into betting, Polymetrics (as of 10/6/2024 4:23 CT) places odds of two quarters of consecutive negative growth in 2024 at 0.4%, NBER declares a recession starting any point in 2024, by April 30, 2025, at 20%.
Addendum (12:25 PT):
Bonus Indicator: Sahm Rule (real time) declines to threshold. Note that peak index due largely to increase in labor force size, rather than unemployed (as was the case in previous episodes, see discussion here).
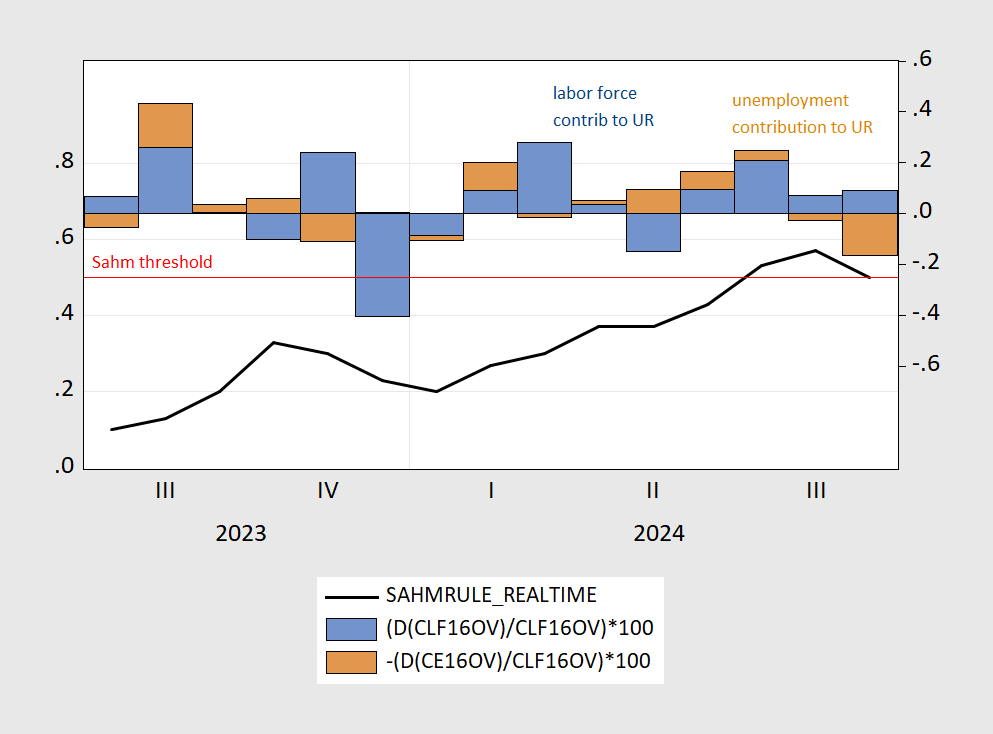
Figure 5: Real time Sahm rule indicator (black, left scale), and contributions to change in unemployment rate, from increased labor force (blue bar, right scale), from greater number of unemployed (brown bar, right scale), all in percentage points. Source: FRED, BLS via FRED, and author’s calculations.
10 year yield increased a quarter point from last week. this will impact mortgages. not enough to cause a recession today, but this is going to put a damper on households and their economic activity. not because the quarter point is a big deal, that magnitude is not. but the thought amongst many was continued drop in rates. many folks who bought in the past couple of years anticipated perhaps a refinance at a lower rate by spring. now that may change, at least the timeline. not enough to impact the election. but enough to impact the possibility of economic slowdown in first half of 2025.
My amateur GDP nowcast was at +3.9% last time I ran it. Take a look: https://4lights.substack.com/