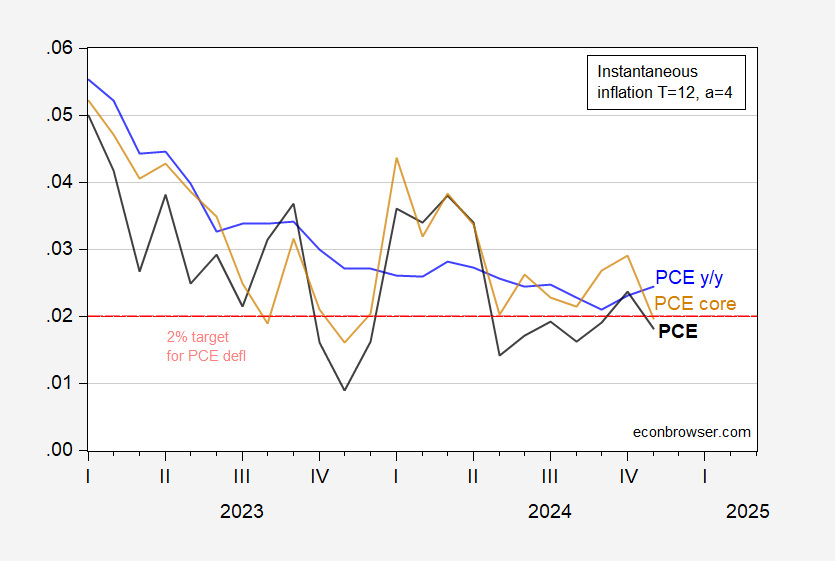
PCE deflator below 2%:
Figure 1: Instantaneous inflation (T=12, a=4) for PCE deflator (black), for core PCE deflator (pink), CPI (tan), and year-on-year PCE deflator (blue). Red dashed line at PCE inflation target. Calculations per Eeckhout (2023). Source: BEA via FRED, and author’s calculations.
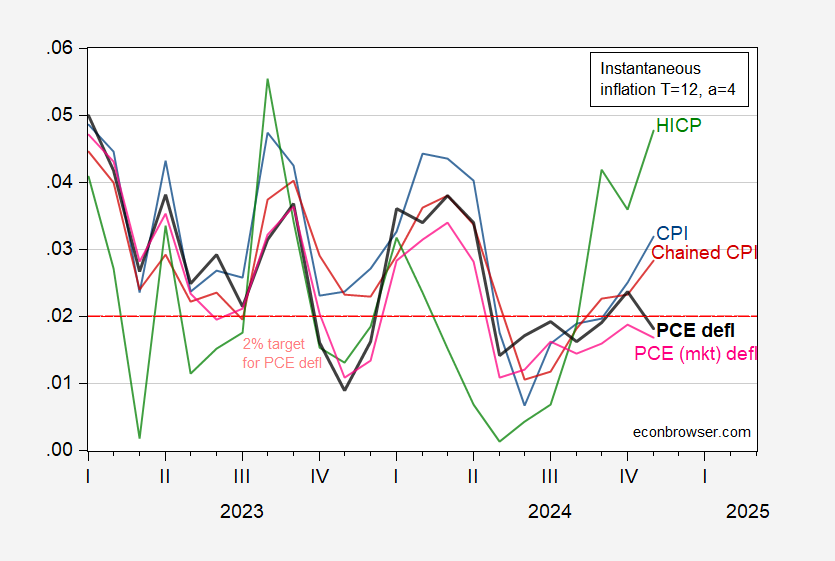
How does the PCE deflator compare against the market prices based PCE deflator, CPI and HICP. Here’re all the series through November.
Figure 2: Instantaneous inflation (T=12, a=4) for PCE deflator (black), for PCE deflator market prices (pink), CPI (blue) chained CPI (red), HICP (green). Red dashed line at PCE inflation target; implied CPI target is 2.45 ppts. HICP and chained CPI seasonally adjusted by author using X-13. Calculations per Eeckhout (2023). Source: BLS, BEA, European Commission via FRED, and author’s calculations.


I would be grateful if you could teach me what make PCE different from CPI.
In November, both CPI & PPI rose about +0.3% mom, while PCE rose just +0.1% mom.
Is it not that PPI should be a leading indicator of CPI, and CPI is a leading indicator of PCE?
Thank you for your help in advance.
Tomo Nakamaru: On PCE vs CPI, see CEA (2023). For whether PPI leads CPI, see this post.
Looking at figure 2, the HICP just seem a lot more noisy than the other parameters. But it seem striking that the PCEparameters are diverging from the CPI’s just like a year ago. But in addition it also seems they are going in opposite directions. I am not sure if that is just a fluke or noice or has some kind of real implication.
Ivan: HICP does not include housing costs, which are big in CPI; also, I seasonally adjusted the aggregate instead of the the sub-aggregates (which would be done for CPI by the BLS). PCE is chain weighted and has different weights than CPI. Many reasons why they could differ.