Contrary to expectations, nonfarm payroll employment surprises +256K vs. +164K Bloomberg consensus. The standard deviation of changes is 85K, with mean +186 (over 2024), which means the surprise is about one standard deviation.
Several observers have questioned the accuracy of the CES measure of nonfarm payroll employment. On the basis of the preliminary benchmark, Heritage’s EJ Antoni argued the recession started in July. However, it’s apparent to me that there is some debate over the level of series.
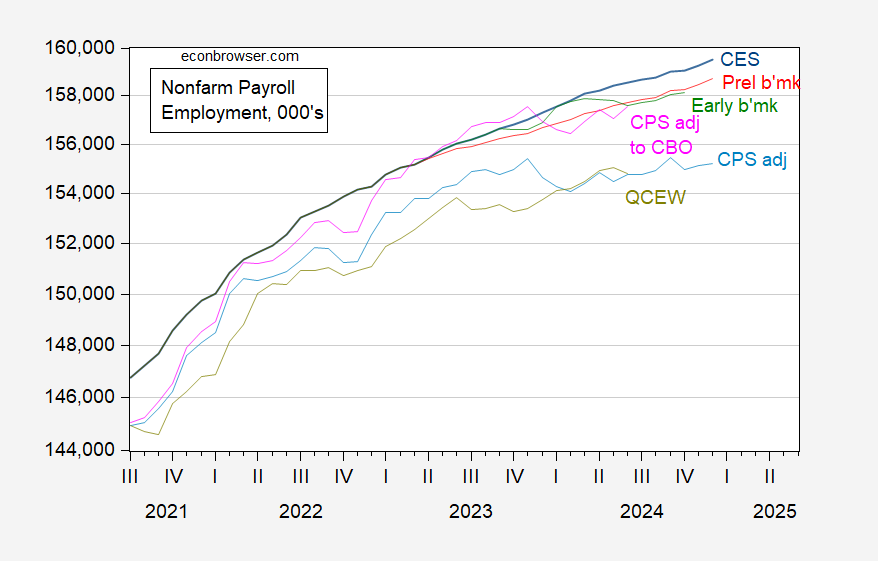
Figure 1: Nonfarm payroll employment from CES (blue), implied from preliminary benchmark (red), implied from Philadelphia Fed early benchmark (green), CPS adjusted to nonfarm payroll concept (blue), CPS adjusted to nonfarm payroll concept, adjusted to incorporate CBO estimates of immigration (pink), QCEW total covered employment seasonally adjusted by author using X-13 (chartreuse), all in 000’s. Source: BLS via FRED, BLS, Philadelphia Fed, and author’s calculations.
Here’s the implication of the employment release (and implied preliminary benchmark) for business cycle indicators.
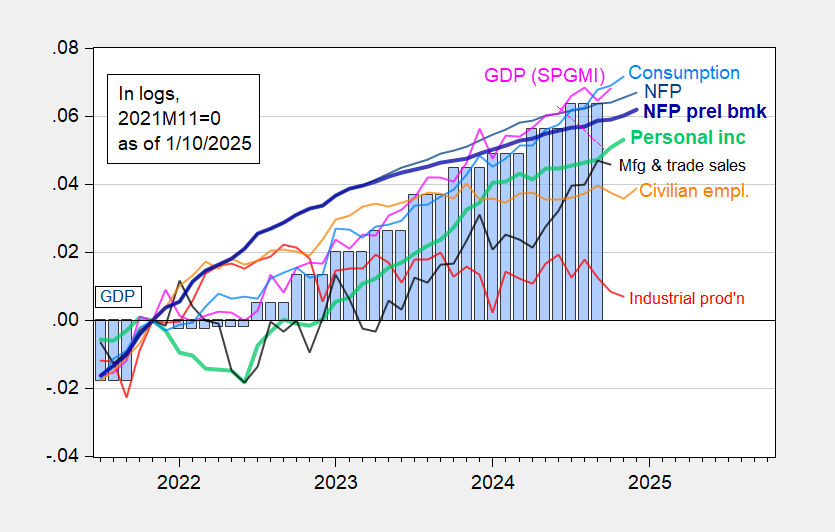
Figure 2: Nonfarm Payroll (NFP) employment from CES (blue), implied NFP from preliminary benchmark (bold blue), civilian employment (orange), industrial production (red), personal income excluding current transfers in Ch.2017$ (bold light green), manufacturing and trade sales in Ch.2017$ (black), consumption in Ch.2017$ (light blue), and monthly GDP in Ch.2017$ (pink), GDP (blue bars), all log normalized to 2021M11=0. Source: BLS via FRED, Federal Reserve, BEA 2024Q3 3rd release, S&P Global Market Insights (nee Macroeconomic Advisers, IHS Markit) (12/2/2024 release), and author’s calculations.
At least from the employment release, economic activity looks pretty robust at the end of the Biden administration.
The coincident economic data, of course including yesterday’s jobs report, continues to look pretty good. There are definitely some dark clouds on the horizon, though. Long term interest rates including mortgage rates have risen again. Data from the housing sector, with the sole exception of employment, is all down – with mortgage applications in particular at or near their post-pandemic lows. Another important leading sector, heavy truck sales, are also down substantially. As to employment, the leading big sector of goods producing employment is down, although consistent with just a slowdown or pause.
What is surprising is just how much construction employment has continued to power ahead. The broad consumer economy continues to move forward based on real income gains, especially in the aggregate.
On another subject I wanted to call to everyone’s attention: this group was recommended by one of the economists I follow (Aaron Sojourner or Ben Casselman I think). “Friends of the BLS”:
https://www.friendsofbls.org/join
This place ought to be a good organization to get early warning of, and organize against, an attempt to turn the BLS statistical section into political hacks. I already joined, and I recommend that everybody else here who is interested in reliable non-partisan economic data do so as well.
Thank you. Joined.
I neglected to add that the annual revisions next month should be doozies, as the immigrant surge is likely to show up in the Household numbers, and the QCEW shortfalls are likely to result in substantial downward revisions in the Establishment survey.
Antoni is going off claiming government employment growth is way too high never telling his readers that FEDERAL government employment is still only 3 million. AND he is claiming we have too many people working in the health care sector.