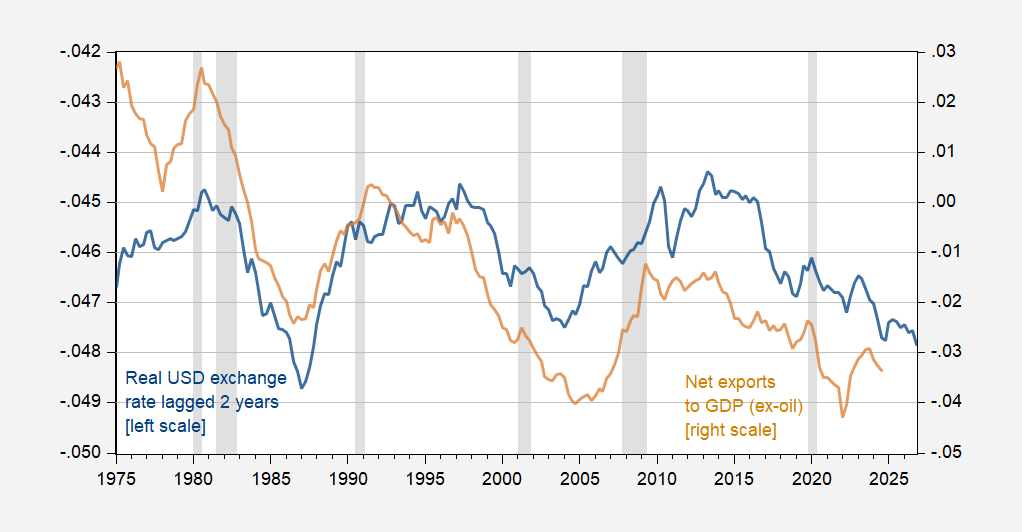
Paul Krugman writes on The Dollar and the US Trade Deficit today, and reminds me of my favorite graph (makes an appearance each time I teach macro, and a version shows up in Chapter 13 of Chinn-Irwin International Economics.
Figure 1: Log real trade weighted dollar exchange rate, lagged two years (blue, left scale), net exports ex-petroleum to GDP ratio (tan, right scale). An increase in the exchange rate series is a depreciation. NBER defined peak-to-trough recession dates shaded gray. Source: Federal Reserve, BEA via FRED, and NBER, and author’s calculations.
Figure 1 is actually a mashup of Krugman’s Figures 1 and 2, with the exchange rate series lagged two years.
So, in some ways the die is cast, if macro rules the trade balance…

Am I misunderstanding the graph? Is it showing that, historically, a weakening of the dollar has reliably foreshadowed a decrease in exports?! If so, what’s the logic behind such a counterintuitive result? Or am I simply not understanding the variables being graphed?
AD: I’ve inverted the trade weighted exchange rate series. See notes to Figure 1.
Reading comprehension score: F
Notably, variation in the exchange rate matches variation in net exports. And that variation is a big deal – within a business cycle, that’s a big driver of capital investment and hiring in the tradables sector. The underlying trend in net exports might need an additional explanation. Here’s a picture in which the trends match, but variation shows a negative correlation:
https://fred.stlouisfed.org/graph/?g=1CCMc
That’s the federal budget balance against net exports. As the government borrows more, we import more, on trend; it’s a savings balance thing. (As Frederick Pauper pointed out a few days back.)
Business cycle variations tend to obscure that relationship, because the budget deficit widens in recession, while the trade gap narrows; it’s a marginal-propensity-to-import thing.
Ah, here’s Krugman writing about the combined effect of the dollar and the business cycle on the trade balance:
“…a strong dollar had already made U.S. manufacturing uncompetitive on world markets. The effect on the trade balance was temporarily masked by the severe recession of 1981-2, which depressed demand for imports.”
See? I’m not making this stuff up.
Professor Chinn,
Would you please help to understand the exchange rate series calculation that is used for the chart? I have tried to use the FRED series, RBUSBIS, which goes back to 1994 in the regular FRED series, but I cannot seem to calculate your numbers. I have tried log differences for monthly changes and for month (-12) changes, but no cigar. I am curious if the data can be used to infer stock market behavior if exports are affected.
Thanks
AS: I spliced the old goods trade weighted series to the new goods and services trade weighted series reported by the Fed. From 2006 onward, the series matches the current series. I think took the negative of the log series (divided by 100).
Thanks,
Seems may be beyond my paygrade.
Professor Chinn,
Ok, I reread your explanation and computed the negative log divided by 100 and the calculation seems to match the 1994 onward. So, thanks as usual.