In “The Evers Economy Is a Soviet Dream”, Michael Lucas writes:
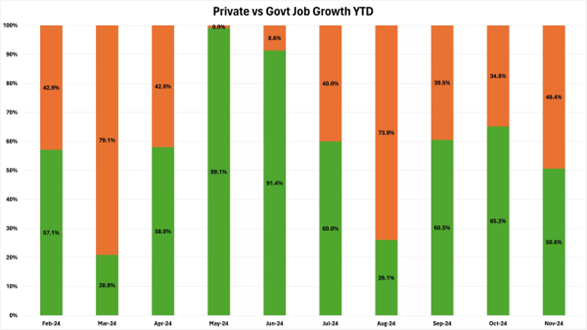
Believe it or not, the data show that a huge share of the “new jobs” [over the last seven months of record employment] Evers is so excited about have been government jobs––50%, in fact!
He deploys this graph:
He fails to note that government jobs have only now in November recouped the levels experienced at the previous peak, at 2020M02. Private employment regained the previous peak levels in 2022M07.
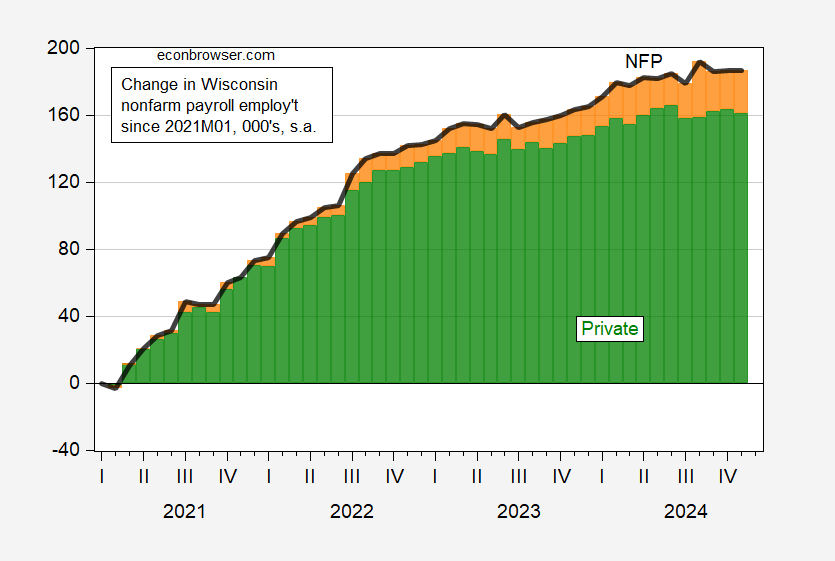
Using the same sample period Mr. Lucas uses to display average weekly hours (2021M01-2024M11), I plot the cumulative changes in private and government employment since 2021M01.
Figure 1: Cumulative change in total nonfarm payroll employment (black line), private nonfarm payroll employment (green bar), in government employment (orange bar), since 2021M01, in 000’s, s.a. Source: BLS, and author’s calculations.
Hence, while it’s true that half of the cumulative employment growth in 2024 has been accounted for by government jobs, but that just reflects the aforementioned catching up phenomenon.
Mr. Lucas continues:
Considering healthy economies have government job growth at rates no higher than 20%, it’s hard to imagine what’s so spectacular about this kind of “record-level” employment; that is, unless you model your form of government after the Soviets: Every man, a Comrade; every worker, an employee of the State; every professional, a part-time, unionized gig worker.
The government share of cumulative growth at the end of November is less than 20%.
Mr. Lucas further writes:
…since November 2021, private sector employees have been working fewer and fewer hours every month for 30 of the last 37 months. Only from September to November of this year did private sector employees start to work more hours than they did the year prior, and the other four months saw no change in average weekly hours. That’s not nearly enough to recover from almost three years of continual cuts in working hours.
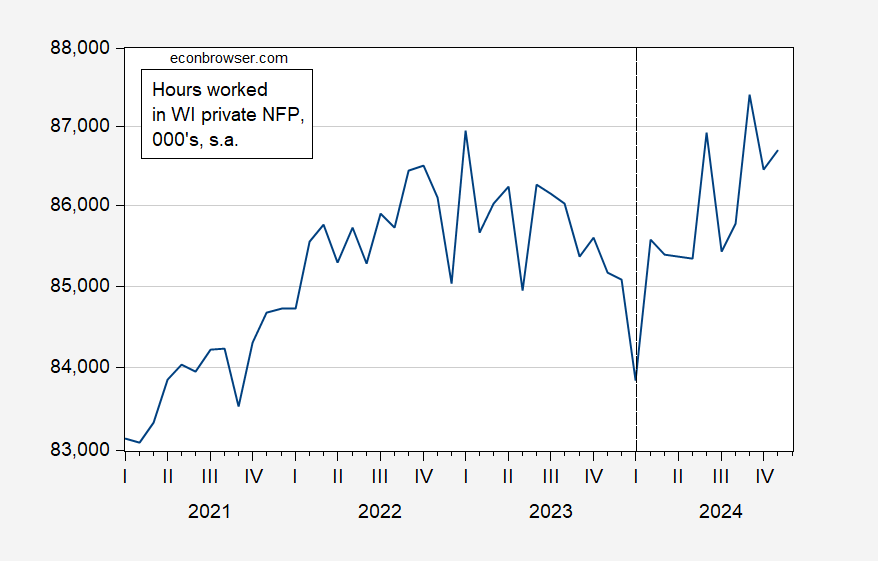
I’m not sure we know if hours have been cut for each job, or the new jobs are at fewer hours. What I can say is that a typical measure of the business cycle involves the aggregate number of hours worked. We can calculate the state level counterpart to the national level aggregate weekly hours worked index (AWHI in FRED) by multiplying number of jobs by average weekly hours (the latter seasonally adjusted). I use Census X-13 to seasonally adjust the weekly hours series, and then calculate total hours worked in the private sector, 2021M01-2024M11.
Figure 1: Total number of hours worked in the private nonfarm payroll sector, in 000’s s.a. (blue). Source: BLS and author’s calculations.
By my counting, aggregate hours in November are up by 3.4% since 2024M01 (and up 1.9% y/y through November).
For more examples of data abuse by MacIver, see [1], [2], [3], [4]. For confusion regarding open economy macroeconomics, see here. MacIver channeling Leontiev, using a Computerized [sic] General Equilibrium Model, here.
The folks who are dumping money into MacIver could surely do better, maybe hiring independent consulting firms.


Competing with EJ Antoni
A little weird that the MacIver Institute is basically saying the government service sector adds no value while at the same time referring to the growth in civil servants as somehow “Soviet.” Apparently they never heard of the Labor Theory of Value, which underpins Marxist economics. Proponents of Marxist LTV economics might agree with him about services. But the real kicker is how the MacIver Institute assumes Leontief technology. As Joan Robinson pointed out, Marxist economics implicitly assumes orthogonal isoquants. So it sounds like the folks at the MacIver Institute are the real (albeit unaware) Soviet comrades.