From the abstract to the paper:
Define a perfect recession predictor as one that correctly predicts every recession and does not falsely signal a recession when one does not occur. The benchmark spreads (10-year minus 2-year and 10-year minus 3-month term spreads, and the near-term forward spread) are far from perfect, and generate up to 59 mispredictions from 1962 to now. Using a supercomputer to search over 645 million series of forward and term spreads that are averaged over different horizons, we discover 83 perfect spreads. In contrast to the benchmark spreads, the perfects tend to be forward spreads starting 4 years out with a moving average of about a year. We use a New Keynesian model to rationalize these features of the perfects and highlight the underlying economic mechanisms. Finally, we expand on the concept of perfect spreads to construct recession-predicting indices and show their superior statistical performances compared to the benchmarks.
Perfect predictors in this instance means an AUROC=1. The obvious question brought forward by this result, at least for policymakers, is whether a recession is likely. I used the first listed perfect forward spread.
The top forward spread is l=53, m=1, n=1. I approximate this using 5 year government bond yield to maturity (60 months) instead of the 53 month zero coupon yield. Then compare this against the 10yr-3mo spread I usually use:
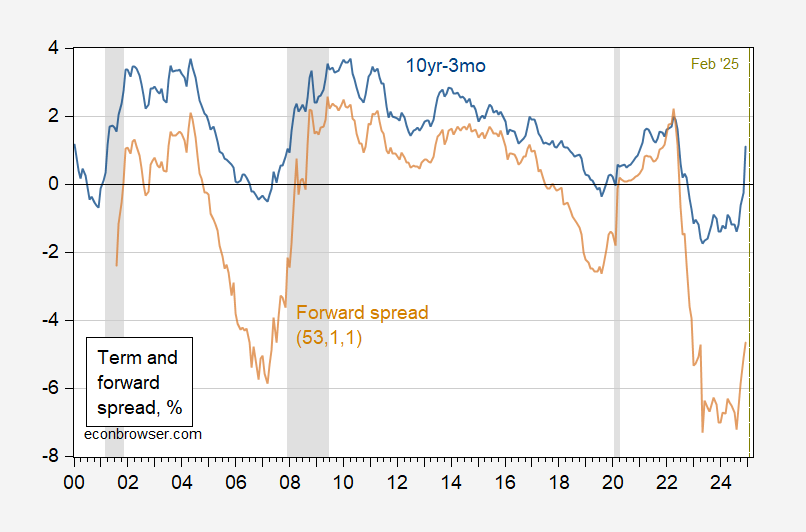
Figure 1: 10year-3month government term spread (blue), forward spread (brown), both in %. Source: Treasury via FRED, and author’ calculations. Source: Treasury via FRED, NBER.
These data lead to this set of estimates of recession in 12 months…. (keeping in mind I estimate the probit models on a different and shorter sample — 2001M08-2025M01 — than do Diercks et al (2025):
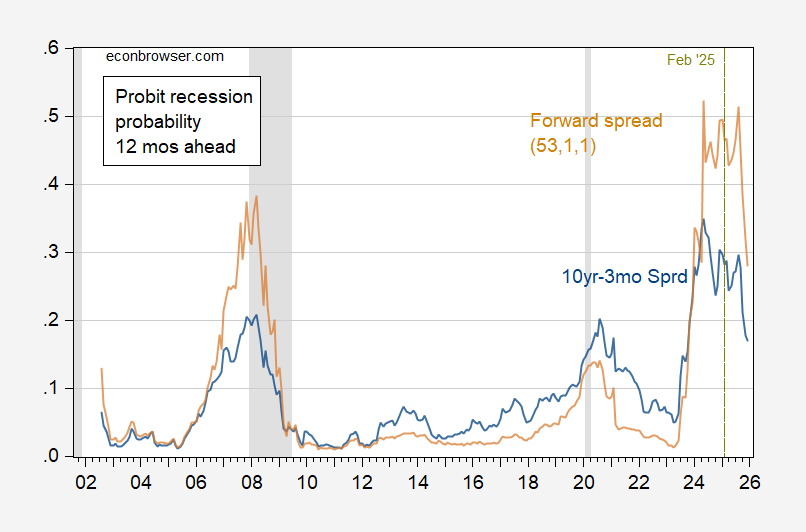
Figure 1: Probit based regression prediction for 10year-3month government term spread (blue), forward spread (brown), both in %. NBER defined peak-to-trough recession dates shaded gray. Source: Treasury via FRED, and author’ calculations. Source: Treasury via FRED, NBER.
Needless to say, a recession is still plausible, even if our most recent economic statistics don’t indicate a recession. According to the forward spread there is a better than even chance of a recession as of February.
Diercks et al. searched over millions of combinations involving spreads and forward spreads, but did not consider other variables. A modified Chinn-Ferrara specification estimated over the same sample, but incorporating a debt-service ratio, yields only a 10% probability of recession for January 2025.
Which is why we need the government to spend even more than it did in during the Biden Administration to prevent the recession and keep our nation fiscally sound.
https://fred.stlouisfed.org/series/A091RC1Q027SBEA
I am unaware if any elected official in DC advocating for uncreased spending. Perhaps you should run, making higher spending your platform.
Your focus on spending, rather than on the budget balance, suggests a limited understanding of the causes of the increase in interest costs. Your choice to link to simple interest costs, not normalized to the size of the economy, likewise suggests poor understanding. Here are revenues, which you failed to mention, along with outlays, as a share of GDP:
https://fred.stlouisfed.org/graph/?g=1DNKm
As this picture shows, federal outlays came down sharply in the latter part of the Biden administration, to a share of GDP that is in line with recent decades. Revenues have, in recent decades, averaged a lower share of GDP tha in the 1980 to 2000 period. Your guy is pushing for an enlargement of the deficit through tax cuts. If you want larger deficits through increased spending, make your case to him.
Here is the effective fed funds rate, the principal driving force behind higher interest costs, and the result mostly of Covid:
https://fred.stlouisfed.org/series/FEDFUNDS
Perhaps you should take the Covid episode into account?
Finally, here are interest costs expressed in a more useful way, as a share of GDP:
https://fred.stlouisfed.org/graph/?g=1DNIz
Higher? Yes, but we’ve dealt with higher interest than this.
MD,
A follow-up to the comments about INDPRO and IPMAN. Both indices were reported 2/14/2025.
IPMAN’s index value for January 2025 is just about right on the declining trend line for the model I mentioned a week or so ago.
INDPRO’s January index is near the upper edge of 2 standard errors of the trend line. So, I can’t yet reject my comment about the declining trend for INDPRO
A couple of things come to mind. First, there’s the secular vs cyclical distinction. Goods output as a share of GDP has been falling, services rising, for a good long while:
https://fred.stlouisfed.org/graph/?g=1DNZU
That is not, however, what you are observing. Both industrial production and manufacturing production continued to rise even as goods production became a smaller share of total output, until the Great Recession, and has since been roughly sideways:
https://fred.stlouisfed.org/graph/?g=1DO0E
A downward trend in either series is therefore arguably cyclical, at least till we see a full business cycle of falling goods output. That’s your point, I think.
All of which is my long-winded way of saying “Uh, oh, cyclical downturn in a leading sector? That’s not good.”
The big policy-induced rise in construction of factories is still underway. Much of the output from the factories in question hasn’t begun. That’s not a cyclical factor, unless we end up guessing that recession was avoided because of those new factories. I don’t have a good feel for how large a share of overall factory output the Biden-era boost to factory construction is, but I imagine large enough to put an upward kink in the data series. Enough to stave off recession? No idea.
MD,
I have been thinking about your comment on cycles.
I just looked at an EViews 14 notice regarding Professor Hamilton’s model to determine cycles. A few years ago, Professor Hamilton posted an analysis on Econbrowser of cycles comparing his method to the Hodrick-Prescott Filter.
https://blog.eviews.com/2017/07/hamiltons-why-you-should-never-use.html
Going through the steps related to identifying cycles for INDPRO, IPMAN and IPDMAN, each series’ cycle is negative using log data. Significant negative cycle readings correlate with recessions as can be seen on the EViews link related to employment data.
Gotta keep those tricky structural changes in mind. Abundant reserves and the Fed making a big plastic in the available supy of Treasury assets could affect the behavior of rates. Maybe even “perfect ” indicators could run afoul of structural change.
Lawler on the neutral rate: https://calculatedrisk.substack.com/p/lawler-more-ruminations-on-the-neutral?utm_source=substack&utm_medium=email
This would suggest that in fact it was China’s surpluses which kept interest rates low in the 2007-2019 period.
If true, then we have to pay for deficits and accumulated debt with real money. With debt near 100% of GDP, that’s material to the federal budget.
I think the default setting for Trump is lots more debt, notwithstanding all the cost cutting rhetoric. But if you have to pay it back at 4.6%, well, there’s limited scope for increased borrowing.
“This would suggest that in fact it was China’s surpluses which kept interest rates low in the 2007-2019 period.” Excuse me buy neither Lawler nor McBride made any such statement. Dude – quit making trash up.
Surplus? If you mean the current account surplus, then that’s partly right. China’s surpluses ended up supplying capital to the rest of the world, yes and that helps reduce term premiu. It was, however, Chinese and other low-wage economies’ labor and capital investment which kept inflation low, and low inflation which kept central bank rates low. The combination of low short-term rates and flat curves largely account for the low borrowing rates of the past couple of decades. China, et al, but more than just the current account.
If you search millions of combinations then there is a very high chance that you can get a perfect predictor of the past. Your models just keep adjusting until you are there.
However, I am not sure the result gets any better at predicting the future, than the model that predicts 9 out of 10 past recessions. If that 1 out of 10 “missed” is a crazy outlier, then the perfect fit model may actually be worse at predicting the future.
I am glad they are trying to support their model with mechanisms – and not just crunching numbers into a smooth paste.
Wasn’t Cynthia Wu one of Jim Hamilton’s grad students? She’s done well.