Third release on GDP. We now have a reading on GDO, as well as an updated view on GDP+.
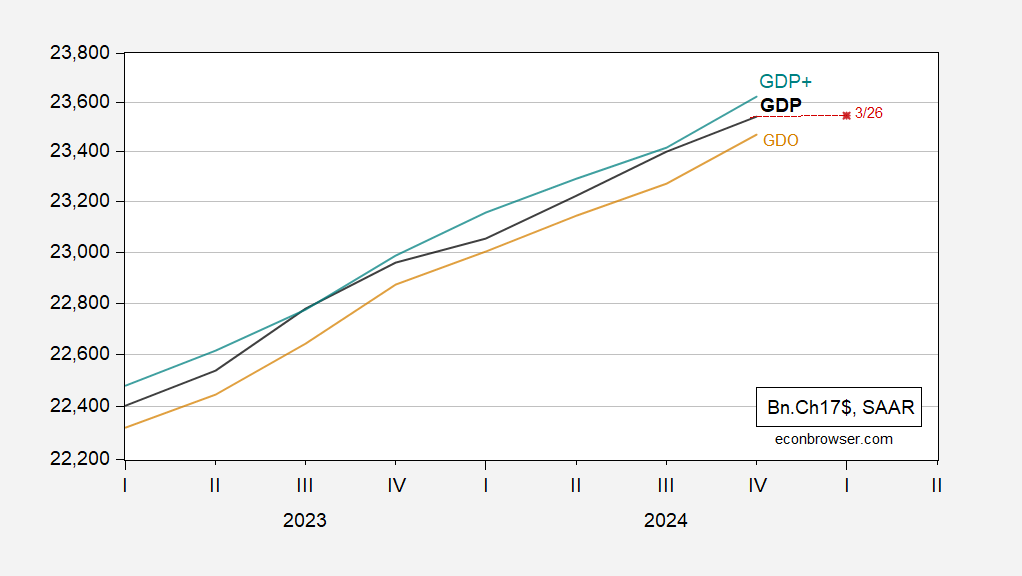
Figure 1: GDP (black), GDO (tan), GDP+ (green), GDPNow of 3/26, adjusted for gold imports of (red square), all in bn.Ch.2017$ SAAR. Source: BEA 3rd release, Philadelphia Fed, Atlanta Fed, and author’s calculations.
Note that I am plotting not the standard GDPNow, but the one accounting for gold imports. The standard, unadjusted, reading is -1.8%.
The downshift in growth that is nowcasted is made more profoundly clear when looking at q/q growth rates:
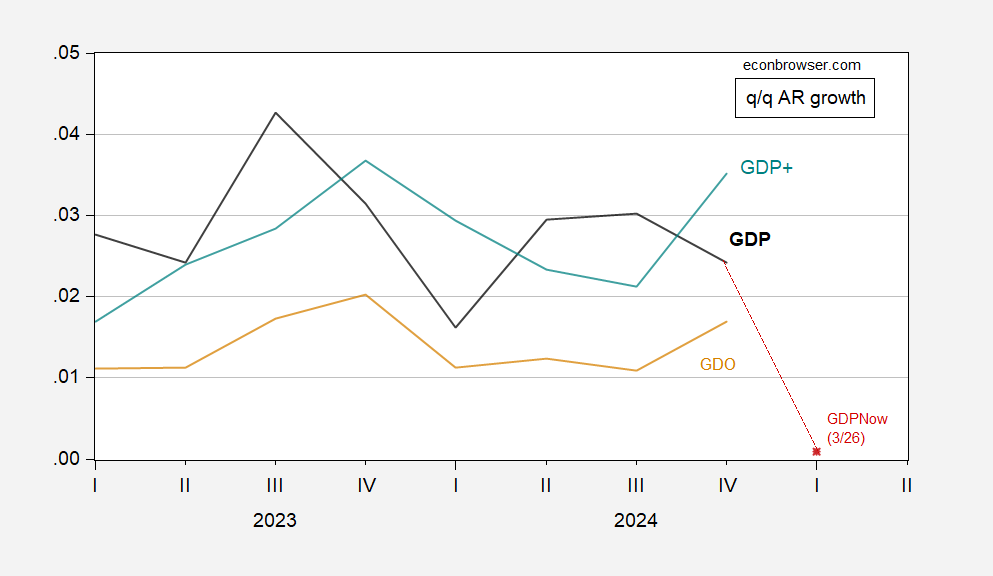
Figure 2: GDP (black), GDO (tan), GDP+ (green), GDPNow of 3/26, adjusted for gold imports of (red square), all q/q growth rates annualized (calculated as log differences). Source: BEA 3rd release, Philadelphia Fed, Atlanta Fed, and author’s calculations.
One of the big contributors to the deceleration in nowcasted consumption growth in Q1: 0.5% vs 2.9% in Q4.
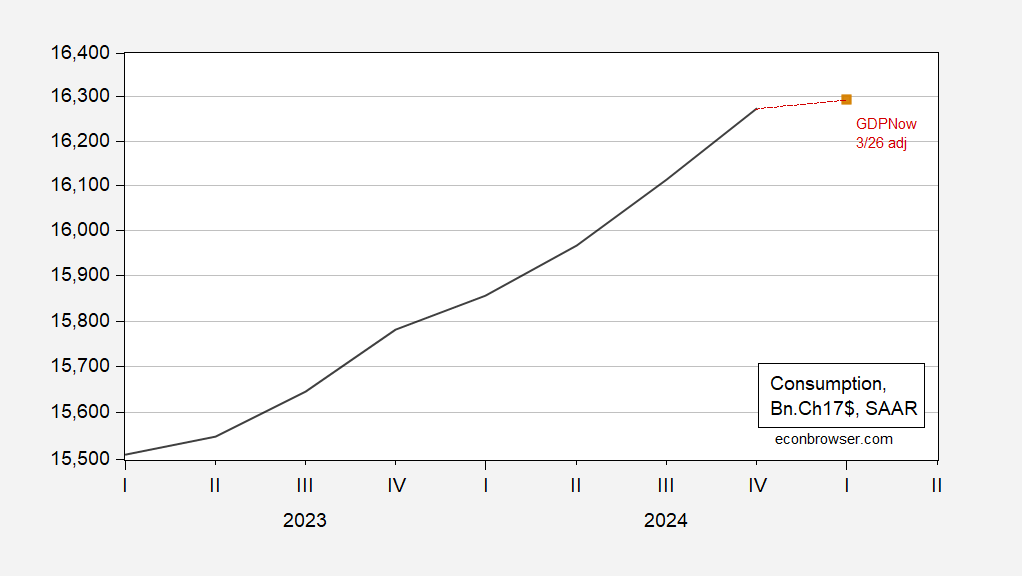
Figure 3: Consumption (black), and GDPNow of 3/26, adjusted for gold imports (red square). Source: BEA 3rd release, Atlanta Fed and author’s calculations.
GDPNow tomorrow will reflect the consumption numbers for February, coming in the income and spending release.
Well, if you thought it couldn’t get more looney tunes, Trump has threatened to punish American automakers if they raise prices in response to the tariffs to take effect April 2. So, what, are they supposed to go bankrupt when the cost of building cars goes up by thousands of dollars? Does he really believe that tariffs are paid by immaculate conception?
The dementia is getting stronger each day.
he has backed himself into a corner. he doubled down on the tariff talk. now he needs to take some action, or he looks fake. but the reality sets in that any tariff will cause an increase in price. this is his attempt to deflect blame onto others. its the bad automakers that are raising prices, not his tariffs. controlling the narrative is what he is actually pretty good at, because he has no morals or ethics to filter his comments.
Fortunately, inflation should decline on this news, right? Right? Uh oh…..
chained 2017 dollar PCE figures for January and February from table 4 of the income and outlays PDF compared to chained 2017 dollar PCE for the 4th quarter from table 3 of the pdf for the GDP report:
(((16,257.6 +16,274.2)/2) / 16,273.2) ^ 4 = 0.998206846
or, in press release math, down 0.2%
hence, if March real PCE does not improve from the average of January and February, growth in PCE would subtract about 0.12 percentage points from the growth rate of the 1st quarter