Analysis of current economic conditions and policy
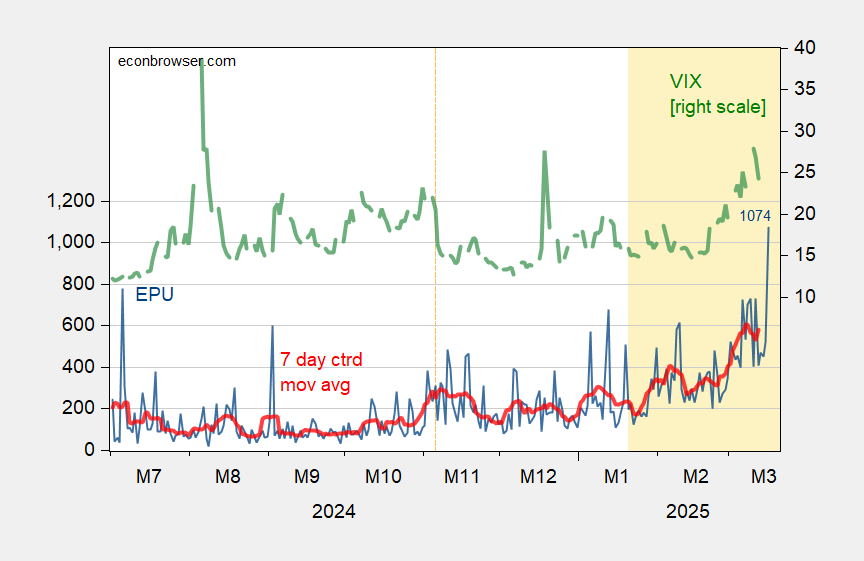
Economic Policy Uncertainty at Recorded Maximum
Latest updated data, 3/16 at 1074.
Figure 1: EPU (blue, left scale), and centered 7 day moving average (red, left scale), VIX (green, right scale). Source: policyuncertainty.com, CBOE via FRED, and author’s calculations.
9 thoughts on “Economic Policy Uncertainty at Recorded Maximum”
James
US Treasury Sec Scott Bessent is not worried about the stock market downturn. “Corrections are healthy,” he said. By which he means – don’t worry sheep – you will be fleeced. By the way – all you folks that Trump/Musk/GOP are forcing to retire right now are doing so into a market downturn – meaning you will start your ten year retirement with a reduced nest egg. For the past 30 years – every time the Republicans get in charge there is a recession – why does the oligarch media keep telling us Republicans are good for the economy?
More proof that EJ Antoni flunked labor economics – a belittling of fringe benefits as part of labor compensation. Of course this MAGA moron thinks spending on health care is waste fraud and abuse.
Macroduck
Wo, now! Holiday leave, sick leave, personal leave, overtime, shift differentials and bonuses – they’re all included in little Antoni’s accounting of “benefits”, even though they are all cash wages.
This boy never fails to reveal his ignorance. Roughly 1/5th of what he calls benefits is actually pay. Antoni claims 41.9% of compensation is what is ‘loosely called “benefits”‘, implying that wages amount to only 58.1% of compensation. Not that that there would necessarily be anything wrong with that, but proper accounting makes clear that wages are actually 67% of compensation, as shown in Antoni’s own chart.
Let’s be clear – he created the chart and tossed various types of compensation into a “loosely called benefits” bucket that he created. He wasn’t misled by sloppy labeling at BLS. Sloppy labeling is all little Antoni. He intentionally misled his readers, all so he could keep ginning up outrage at imagined wrongs. He’s vile.
Macroduck
Success! The felon-in-chief has topped every other president, every every central banker, every policy maker since the beginning of the EPU index (and probably before that) in one thing. It’s a thing that policy makers aren’t supposed to do, bit still…
Being the first convicted felon elected to the presidency is a different sort of thing. The felon hasn’t topped others who’ve also been felons; he’s the only one.
Brucie still thinks he’s talking to fellow faux news drones. No, Brucie, uncertainty is not measured by the 30-dozen-case wholesale price of eggs. This is like when Brucie wanted to distract us from the fact that over 400,000 people died unnecessarily from Covid due to the felon-in-chief’s policies by rattling on about bleach.
Brucie is a tool of the rapist-in-chief’s PR machine. He doesn’t appear to think for himself, so there’s no reason to let him tell anyone else what to think.
After years of resisting calls to boost household consumption, China yesterday announced a plan to boost household consumption. Details are due out today, and until they arrive, who knows whether this is more than a trifle?
The plan to boost consumption is said to include an anti-poverty component, which is never a bad thing. (Well, unless forced labor is involved.) The boost to households is part of a wider set of initiatives to shore up real estate, stocks and credit provision.
Barron’s claims to see nothing new, but since the article is behind a paywall, I can’t tell how they think they know before details are released:
Barron’s seems to have an editorial requirement that writers must pretend to more knowledge than they have and express strong opinions based on pretended knowledge, which makes me suspicious. China, on the other hand, often trots out “new” plans which are mostly a rehash of old plans, so it’s an easy guess that they’re at it again.
US Treasury Sec Scott Bessent is not worried about the stock market downturn. “Corrections are healthy,” he said. By which he means – don’t worry sheep – you will be fleeced. By the way – all you folks that Trump/Musk/GOP are forcing to retire right now are doing so into a market downturn – meaning you will start your ten year retirement with a reduced nest egg. For the past 30 years – every time the Republicans get in charge there is a recession – why does the oligarch media keep telling us Republicans are good for the economy?
https://x.com/RealEJAntoni/status/1901609684030595205
More proof that EJ Antoni flunked labor economics – a belittling of fringe benefits as part of labor compensation. Of course this MAGA moron thinks spending on health care is waste fraud and abuse.
Wo, now! Holiday leave, sick leave, personal leave, overtime, shift differentials and bonuses – they’re all included in little Antoni’s accounting of “benefits”, even though they are all cash wages.
This boy never fails to reveal his ignorance. Roughly 1/5th of what he calls benefits is actually pay. Antoni claims 41.9% of compensation is what is ‘loosely called “benefits”‘, implying that wages amount to only 58.1% of compensation. Not that that there would necessarily be anything wrong with that, but proper accounting makes clear that wages are actually 67% of compensation, as shown in Antoni’s own chart.
Let’s be clear – he created the chart and tossed various types of compensation into a “loosely called benefits” bucket that he created. He wasn’t misled by sloppy labeling at BLS. Sloppy labeling is all little Antoni. He intentionally misled his readers, all so he could keep ginning up outrage at imagined wrongs. He’s vile.
Success! The felon-in-chief has topped every other president, every every central banker, every policy maker since the beginning of the EPU index (and probably before that) in one thing. It’s a thing that policy makers aren’t supposed to do, bit still…
Being the first convicted felon elected to the presidency is a different sort of thing. The felon hasn’t topped others who’ve also been felons; he’s the only one.
Is the uncertainty egg-xaggerated?
https://www.yahoo.com/news/u-egg-prices-halve-since-164421726.html
Brucie still thinks he’s talking to fellow faux news drones. No, Brucie, uncertainty is not measured by the 30-dozen-case wholesale price of eggs. This is like when Brucie wanted to distract us from the fact that over 400,000 people died unnecessarily from Covid due to the felon-in-chief’s policies by rattling on about bleach.
Brucie is a tool of the rapist-in-chief’s PR machine. He doesn’t appear to think for himself, so there’s no reason to let him tell anyone else what to think.
News flash: demand curves are downward sloping.
Big news, or not, out of China:
https://www.bloomberg.com/news/articles/2025-03-16/china-maps-out-plan-to-raise-incomes-and-boost-consumption
After years of resisting calls to boost household consumption, China yesterday announced a plan to boost household consumption. Details are due out today, and until they arrive, who knows whether this is more than a trifle?
The plan to boost consumption is said to include an anti-poverty component, which is never a bad thing. (Well, unless forced labor is involved.) The boost to households is part of a wider set of initiatives to shore up real estate, stocks and credit provision.
Barron’s claims to see nothing new, but since the article is behind a paywall, I can’t tell how they think they know before details are released:
https://www.barrons.com/articles/china-consumption-spending-stimulus-127940f7?mod=googlenewsfeed&st=gBpy2Z
Barron’s seems to have an editorial requirement that writers must pretend to more knowledge than they have and express strong opinions based on pretended knowledge, which makes me suspicious. China, on the other hand, often trots out “new” plans which are mostly a rehash of old plans, so it’s an easy guess that they’re at it again.
Hello